- Phân tích
- Tin tức và các công cụ
- Tin tức thị trường
- NZD/USD Price Analysis: Bulls back off, consolidation may be incoming
NZD/USD Price Analysis: Bulls back off, consolidation may be incoming
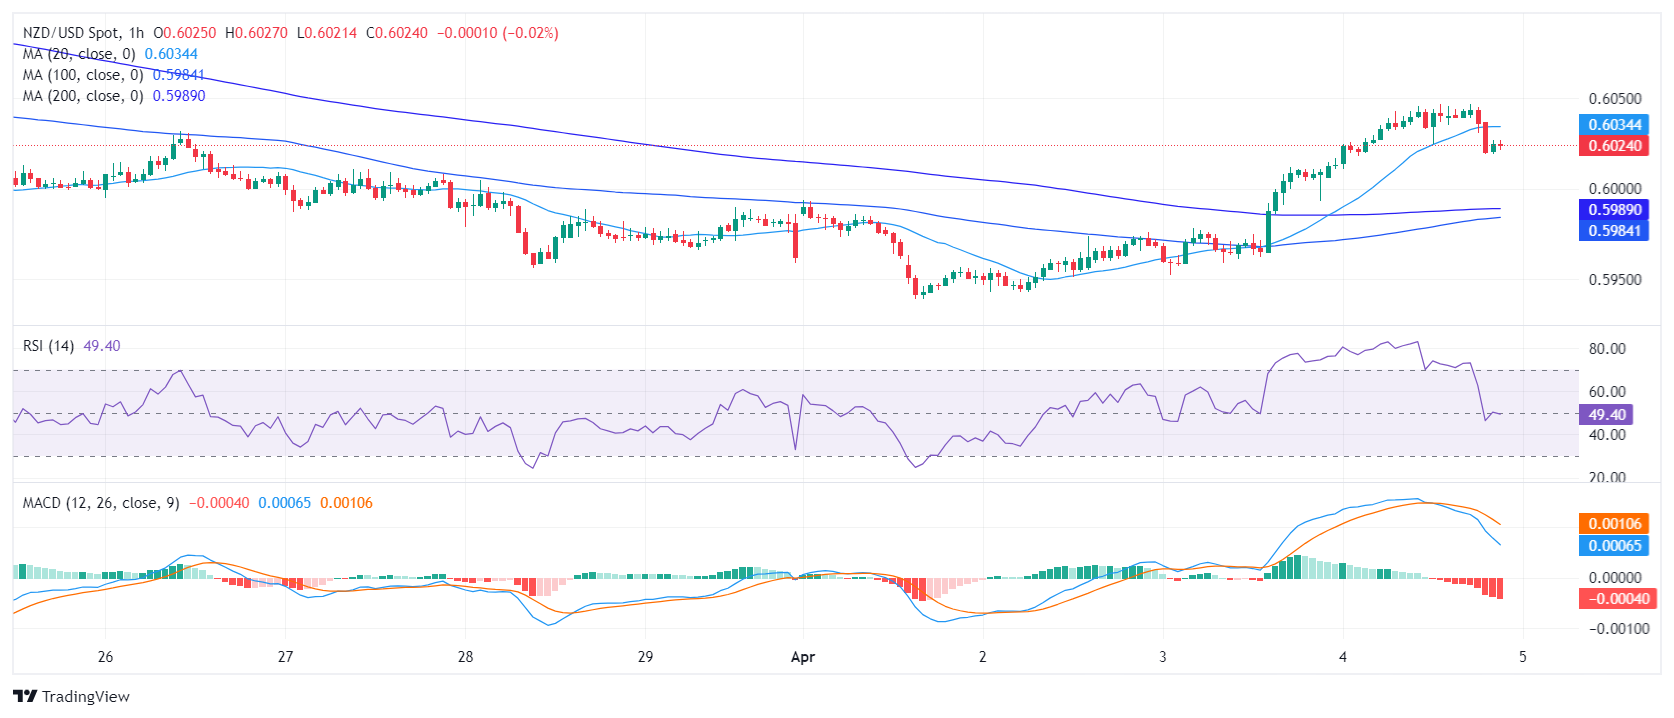
- The hourly chart signals a possible short-term rise in selling pressure with a shar decline in the RSI.
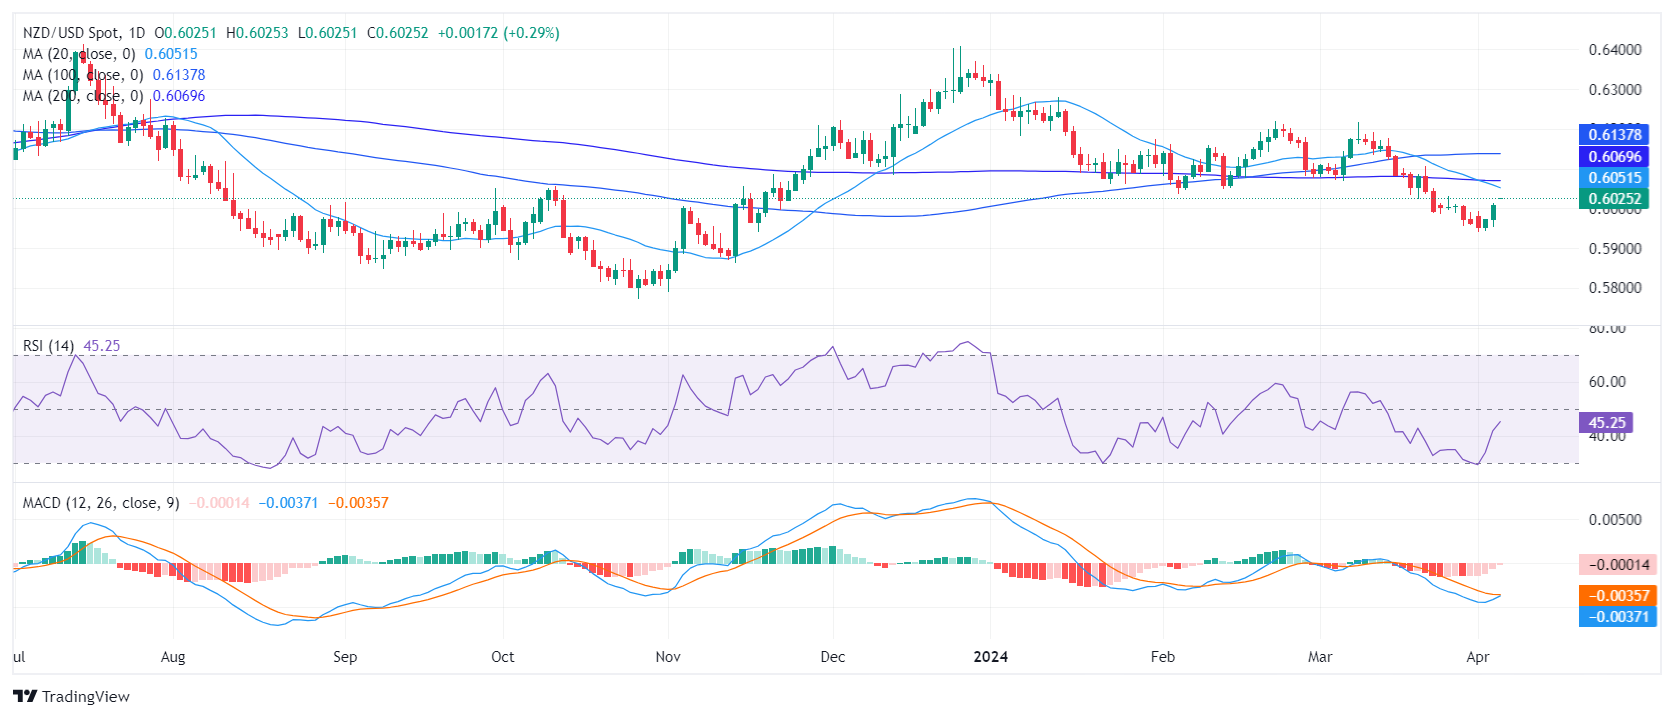
- The negative outlook remains on the daily chart.
- The bearish crossover between the 20 and 200-day SMAs implies a strong negative momentum.
The NZD/USD pair is trading at around 0.6025 and trimmed most of its daily gains on Thursday. After getting rejected by the 20-day Simple Moving Average (SMA) the latest upwards movements seem to have been short-lived and didn’t present a battle to the bearish overall trend.
On the daily chart, the Relative Strength Index (RSI) has shown slow movement from negative to positive territory over past sessions and now resides at around 47.15. However, the flat red bars of the Moving Average Convergence Divergence (MACD) indicate a steady negative momentum.
NZD/USD daily chart
On the hourly chart, the RSI proved more erratic, reaching a positive value of 70 earlier in the session and dropping to 50. This fluctuation suggests a possible short-term shift in momentum favoring the sellers. The MACD, continues to print red flat bars, indicating sustained negative momentum throughout recent hours.
NZD/USD hourly chart
Concerning its Simple Moving Averages (SMAs), the NZD/USD is below the 20,100 and 200-day SMAs. Thursday’s 20-day SMA rejection adds further arguments that the bullish momentum is weak. Moreover, the mentioned average completed a bearish crossover with the 200-day SMA which may eventually limit any upward momentum.


© 2000-2026. Bản quyền Teletrade.
Trang web này được quản lý bởi Teletrade D.J. LLC 2351 LLC 2022 (Euro House, Richmond Hill Road, Kingstown, VC0100, St. Vincent and the Grenadines).
Thông tin trên trang web không phải là cơ sở để đưa ra quyết định đầu tư và chỉ được cung cấp cho mục đích làm quen.
Giao dịch trên thị trường tài chính (đặc biệt là giao dịch sử dụng các công cụ biên) mở ra những cơ hội lớn và tạo điều kiện cho các nhà đầu tư sẵn sàng mạo hiểm để thu lợi nhuận, tuy nhiên nó mang trong mình nguy cơ rủi ro khá cao. Chính vì vậy trước khi tiến hành giao dịch cần phải xem xét mọi mặt vấn đề chấp nhận tiến hành giao dịch cụ thể xét theo quan điểm của nguồn lực tài chính sẵn có và mức độ am hiểu thị trường tài chính.
Sử dụng thông tin: sử dụng toàn bộ hay riêng biệt các dữ liệu trên trang web của công ty TeleTrade như một nguồn cung cấp thông tin nhất định. Việc sử dụng tư liệu từ trang web cần kèm theo liên kết đến trang teletrade.vn. Việc tự động thu thập số liệu cũng như thông tin từ trang web TeleTrade đều không được phép.
Xin vui lòng liên hệ với pr@teletrade.global nếu có câu hỏi.
ngân hàng