- Phân tích
- Tin tức và các công cụ
- Tin tức thị trường
- EUR/JPY Price Analysis: Bullish trend perseveres, bears confronts crucial SMA
EUR/JPY Price Analysis: Bullish trend perseveres, bears confronts crucial SMA
- Continued placement of EUR/JPY above key SMA levels shows strong bullish sentiment.
- The daily chart indicators reveal a loss of the bullish momentum.
- The hourly RSI and rising MACD depict short-term buyers' shift to regain momentum.
- The pair's approach towards the key SMA level at 163.09 raises the possibility of a trend shift.
The EUR/JPY pair currently trades at approximately 164.37, indicating a slight decrease. Despite the bullish trend, traders must closely monitor for potential reversals as the bullish momentum wanes on the daily chart and bears approach the 20-day Simple Moving Average (SMA).
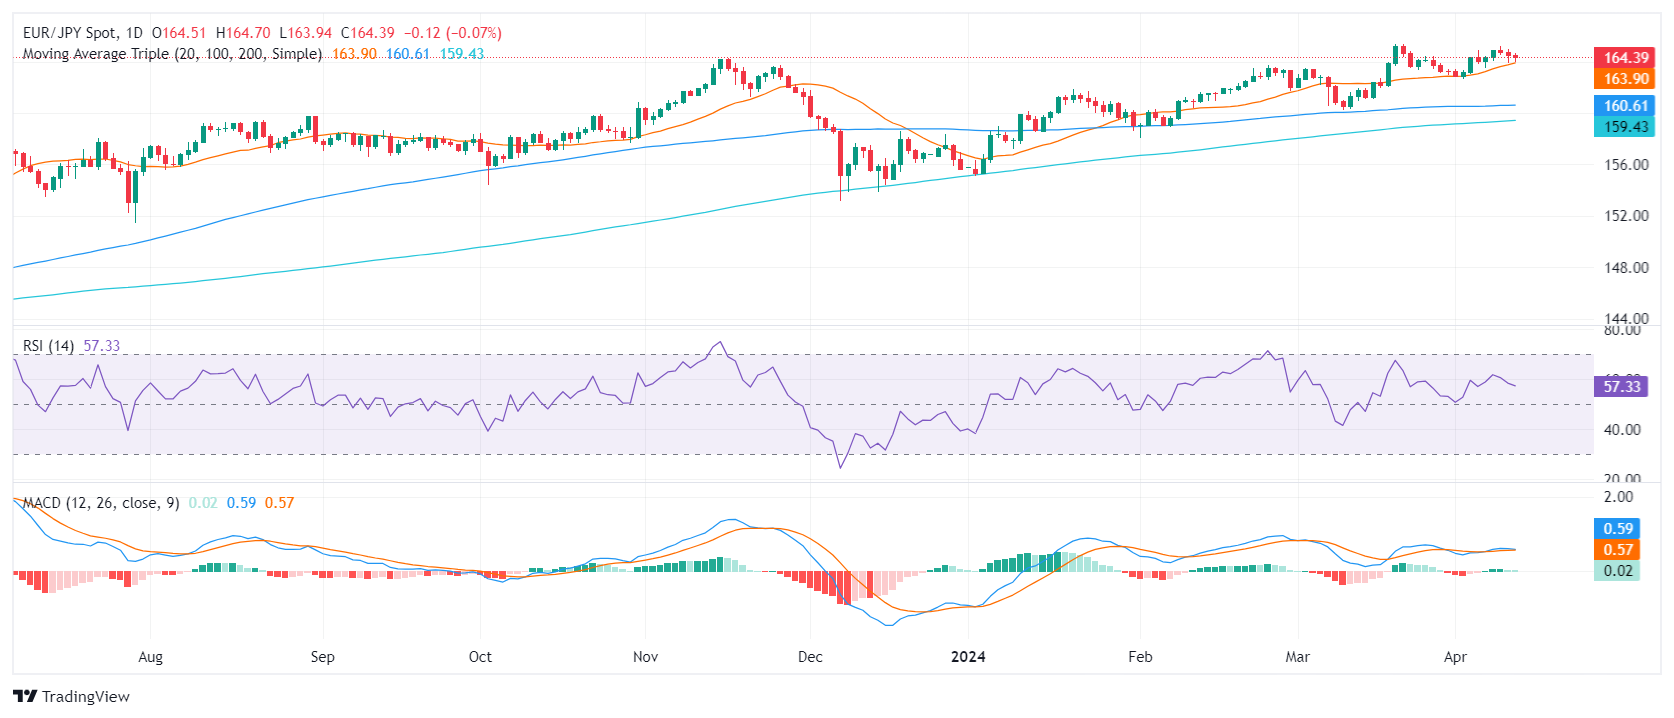
On the daily chart, The Relative Strength Index (RSI) consistently has been within the positive territory, but on Thursday it pointed south suggesting a loss of buying traction. The Moving Average Convergence Divergence (MACD) prints diminish green bars, also adding arguments to the momentum loss.
EUR/JPY daily chart
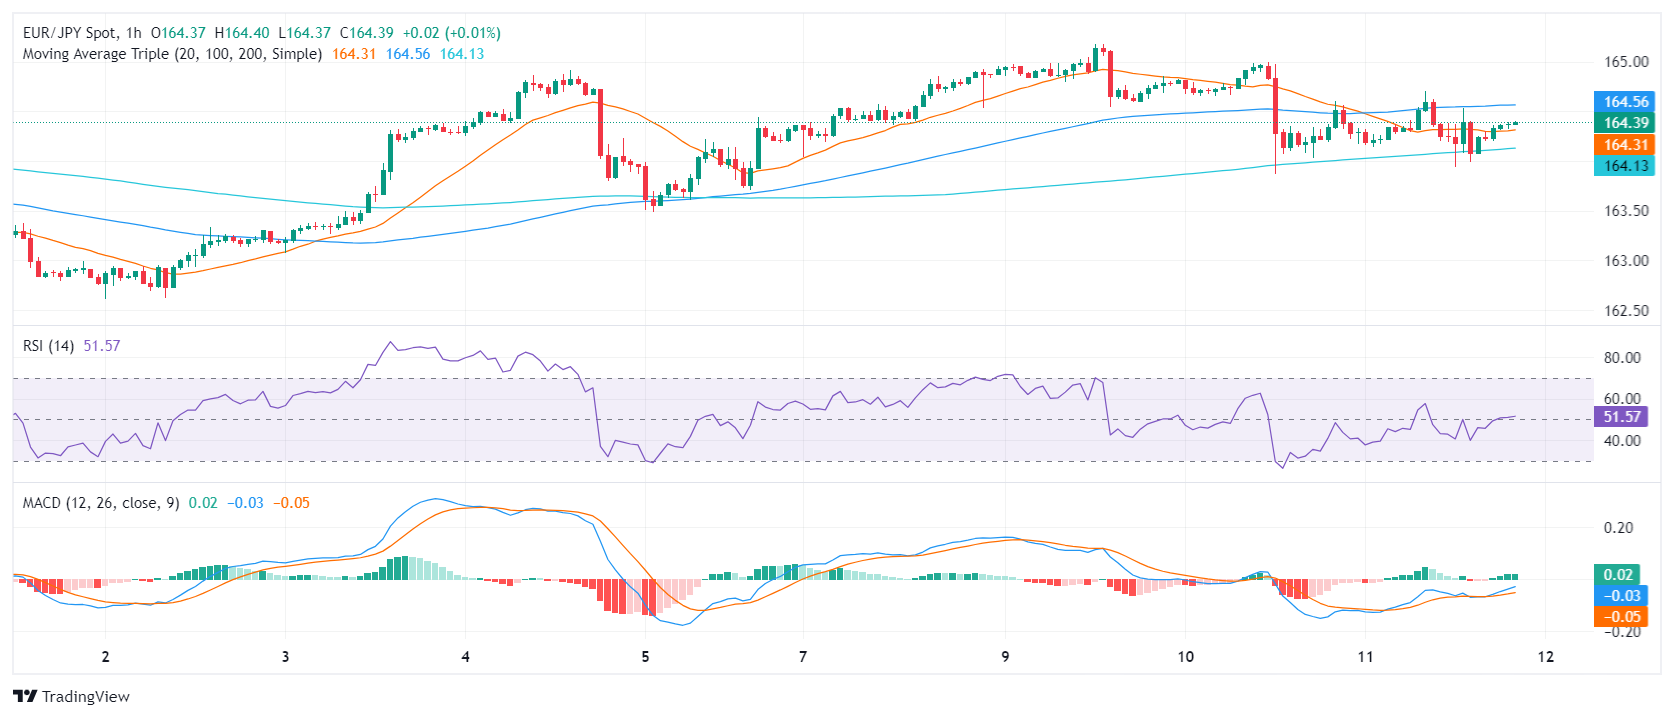
In contrast to the daily chart, the hourly chart tells a slightly different story. Here, the RSI readings fluctuate somewhat, particularly in the latest hours, with a decline towards the negative territory. However, recovery seems likely, as the latest hour reports an RSI value of 51, placing the index back in positive momentum. During these hours, the Moving Average Convergence Divergence (MACD) histogram prints rising green bars, indicating positive momentum.
EUR/JPY hourly chart
For a broader outlook, the EUR/JPY displays significant strength, remaining steadfast above its three crucial Simple Moving Averages (SMA) of 20, 100 and 200-day SMAs. Such positioning generally indicates a sustainable bullish climate, with strong implications for the short and long-term trend. However, today's signals suggest a potential challenge, as the pair edges closer to the 20-day SMA, currently set at 163.09 and any future movement below it could signal a shift to a bearish bias.


© 2000-2026. Bản quyền Teletrade.
Trang web này được quản lý bởi Teletrade D.J. LLC 2351 LLC 2022 (Euro House, Richmond Hill Road, Kingstown, VC0100, St. Vincent and the Grenadines).
Thông tin trên trang web không phải là cơ sở để đưa ra quyết định đầu tư và chỉ được cung cấp cho mục đích làm quen.
Giao dịch trên thị trường tài chính (đặc biệt là giao dịch sử dụng các công cụ biên) mở ra những cơ hội lớn và tạo điều kiện cho các nhà đầu tư sẵn sàng mạo hiểm để thu lợi nhuận, tuy nhiên nó mang trong mình nguy cơ rủi ro khá cao. Chính vì vậy trước khi tiến hành giao dịch cần phải xem xét mọi mặt vấn đề chấp nhận tiến hành giao dịch cụ thể xét theo quan điểm của nguồn lực tài chính sẵn có và mức độ am hiểu thị trường tài chính.
Sử dụng thông tin: sử dụng toàn bộ hay riêng biệt các dữ liệu trên trang web của công ty TeleTrade như một nguồn cung cấp thông tin nhất định. Việc sử dụng tư liệu từ trang web cần kèm theo liên kết đến trang teletrade.vn. Việc tự động thu thập số liệu cũng như thông tin từ trang web TeleTrade đều không được phép.
Xin vui lòng liên hệ với pr@teletrade.global nếu có câu hỏi.
ngân hàng