- Phân tích
- Tin tức và các công cụ
- Tin tức thị trường
- EUR/JPY Price Analysis: Bulls make a stride and reclaim the 20-day SMA
EUR/JPY Price Analysis: Bulls make a stride and reclaim the 20-day SMA
- The daily chart reveals that the EUR/JPY maintains a bullish sentiment, as indicated by the rising RSI and diminishing negative momentum via MACD.
- The hourly chart's RSI shows that the pair is correcting overbought conditions.
The EUR/JPY pair is trading at 164.22, recording a slight uptick on Tuesday’s session. This slight appreciation points towards a continuing strength of the Euro against the Japanese Yen. Despite minor market fluctuations suggesting temporary corrections, the broader technical outlook remains largely bullish. To reinforce this, bulls stepped in and recovered the 20-day Simple Moving Average (SMA) which brightened the outlook for the buyers.
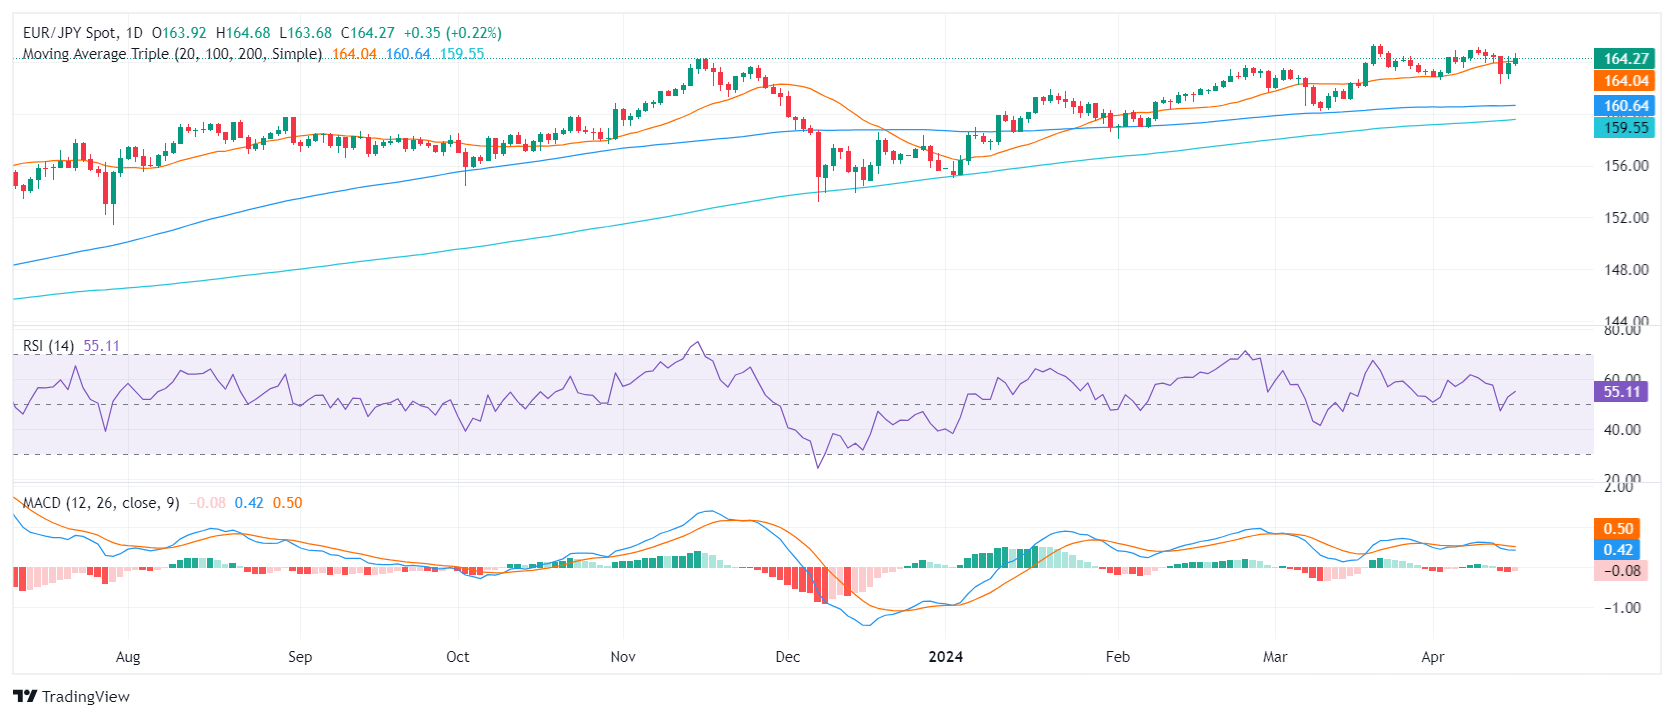
The daily chart reveals that the EUR/JPY pair maintains a bullish momentum, indicated by its Relative Strength Index (RSI) standing at 55, comfortably within the positive trend zone. This is supported by the falling red bars of the Moving Average Convergence Divergence (MACD) histogram, which demonstrates diminishing negative momentum.
EUR/JPY daily chart
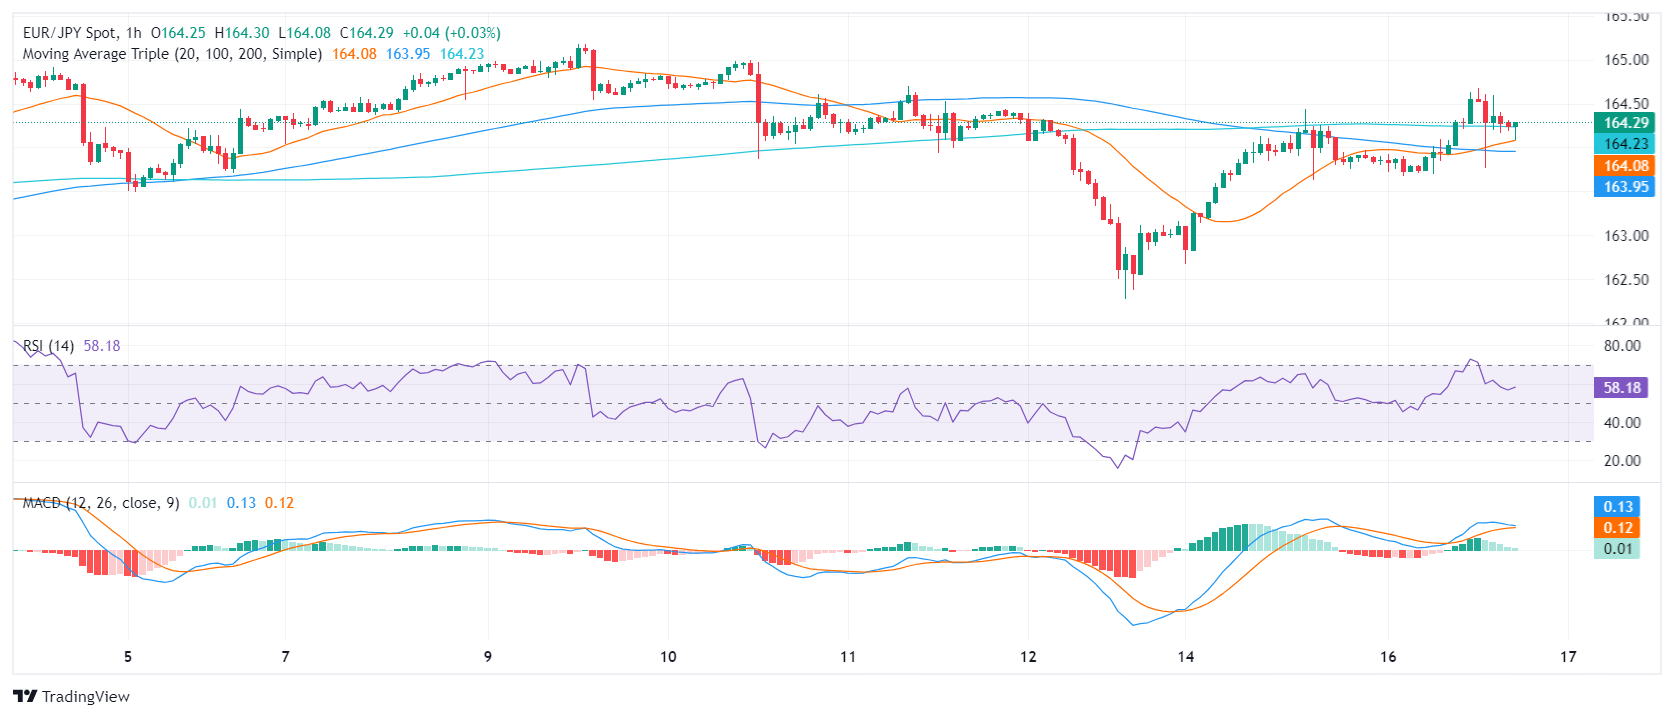
Moving to the hourly chart, recent RSI readings oscillate between 71 and 54, suggesting the buyers are taking a quick breather. In addition, the relatively flat green bars of the hourly MACD indicate a nearly stagnant positive momentum.
EUR/JPY hourly chart
The broader outlook of the EUR/JPY based on its position relative to the Simple Moving Average (SMA) provides more insight. The EUR/JPY jump above the 20-day SMA today may signal a sharp short-term uptick, suggesting buy opportunities for traders. Moreover, its position above both the 100-day and 200-day SMA confirms a long-term bullish trend, implying that the Euro retains its strength against the Japanese Yen.


© 2000-2026. Bản quyền Teletrade.
Trang web này được quản lý bởi Teletrade D.J. LLC 2351 LLC 2022 (Euro House, Richmond Hill Road, Kingstown, VC0100, St. Vincent and the Grenadines).
Thông tin trên trang web không phải là cơ sở để đưa ra quyết định đầu tư và chỉ được cung cấp cho mục đích làm quen.
Giao dịch trên thị trường tài chính (đặc biệt là giao dịch sử dụng các công cụ biên) mở ra những cơ hội lớn và tạo điều kiện cho các nhà đầu tư sẵn sàng mạo hiểm để thu lợi nhuận, tuy nhiên nó mang trong mình nguy cơ rủi ro khá cao. Chính vì vậy trước khi tiến hành giao dịch cần phải xem xét mọi mặt vấn đề chấp nhận tiến hành giao dịch cụ thể xét theo quan điểm của nguồn lực tài chính sẵn có và mức độ am hiểu thị trường tài chính.
Sử dụng thông tin: sử dụng toàn bộ hay riêng biệt các dữ liệu trên trang web của công ty TeleTrade như một nguồn cung cấp thông tin nhất định. Việc sử dụng tư liệu từ trang web cần kèm theo liên kết đến trang teletrade.vn. Việc tự động thu thập số liệu cũng như thông tin từ trang web TeleTrade đều không được phép.
Xin vui lòng liên hệ với pr@teletrade.global nếu có câu hỏi.
ngân hàng