- Phân tích
- Tin tức và các công cụ
- Tin tức thị trường
- NZD/JPY Price Analysis: Seller control the short term,overall trend remains bullist
NZD/JPY Price Analysis: Seller control the short term,overall trend remains bullist
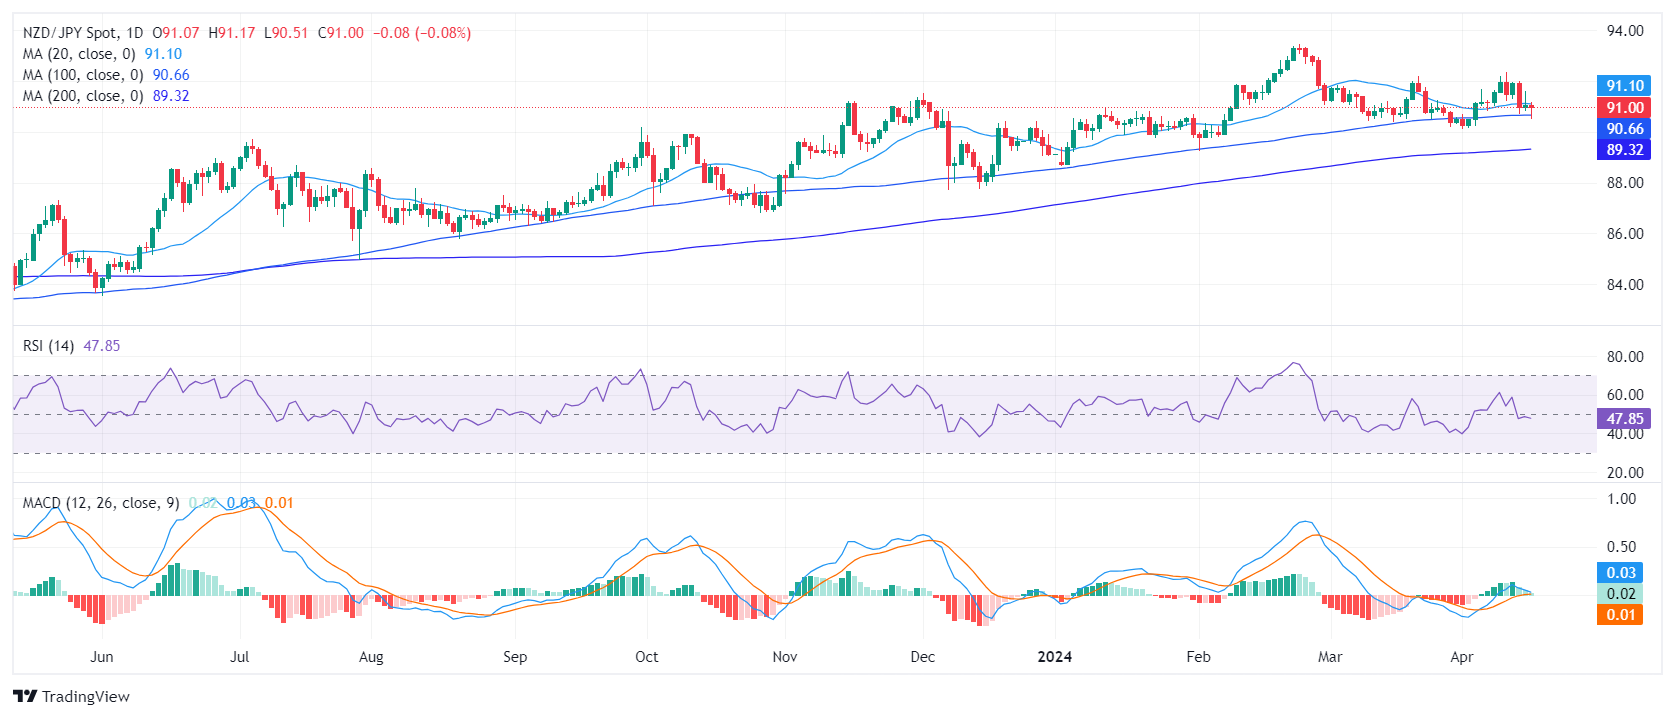
- The daily RSI reveals that market momentum is currently dominated by sellers.
- The daily MACD presents flat green bars, indicating a lack of buying traction.
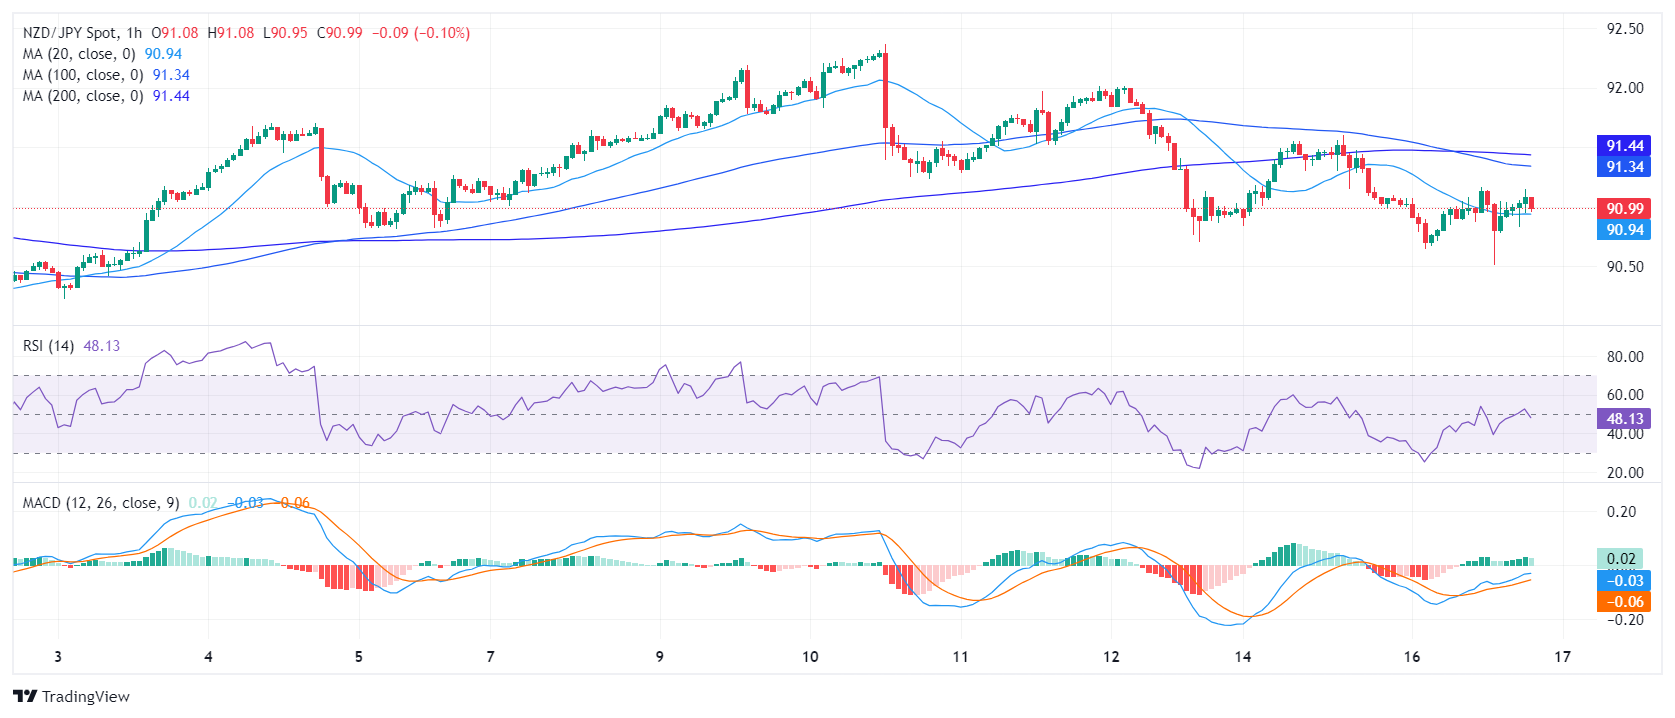
- In the hourly chart, the RSI shows slight improvement, suggesting sellers losing some ground.
The NZD/JPY stabilized at around 90.94 and managed to clear most of its daily losses. However, in the shorter time frames, there are signs of a bullish recovery.
The daily Relative Strength Index (RSI) hovers in the negative territory. The most recent reading fell to 48, reflecting a market momentum currently dominated by sellers. Furthermore, the Moving Average Convergence Divergence (MACD) histogram prints flat green bars, indicating a lack of positive momentum.
NZD/JPY daily chart
Transitioning to the hourly chart, the RSI seems to confirm the tepid sentiment observed on the daily chart. The most recent reading also lands in the 48 range. Nevertheless, signs of slight improvement towards the positive territory appear in the RSI and the latest session reading climbed from a preceding low of 41. Moreover, the MACD histogram on the hourly chart prints green bars, suggesting a possible pick-up in positive momentum.
NZD/JPY hourly chart
The broader outlook, on the other hand, suggests that the bulls control the overall trend, but as long as the buyers fail to reclaim the 20-day Simple Moving Average (SMA), the short-term outlook will remain tilted in favor of the buyers.


© 2000-2026. Bản quyền Teletrade.
Trang web này được quản lý bởi Teletrade D.J. LLC 2351 LLC 2022 (Euro House, Richmond Hill Road, Kingstown, VC0100, St. Vincent and the Grenadines).
Thông tin trên trang web không phải là cơ sở để đưa ra quyết định đầu tư và chỉ được cung cấp cho mục đích làm quen.
Giao dịch trên thị trường tài chính (đặc biệt là giao dịch sử dụng các công cụ biên) mở ra những cơ hội lớn và tạo điều kiện cho các nhà đầu tư sẵn sàng mạo hiểm để thu lợi nhuận, tuy nhiên nó mang trong mình nguy cơ rủi ro khá cao. Chính vì vậy trước khi tiến hành giao dịch cần phải xem xét mọi mặt vấn đề chấp nhận tiến hành giao dịch cụ thể xét theo quan điểm của nguồn lực tài chính sẵn có và mức độ am hiểu thị trường tài chính.
Sử dụng thông tin: sử dụng toàn bộ hay riêng biệt các dữ liệu trên trang web của công ty TeleTrade như một nguồn cung cấp thông tin nhất định. Việc sử dụng tư liệu từ trang web cần kèm theo liên kết đến trang teletrade.vn. Việc tự động thu thập số liệu cũng như thông tin từ trang web TeleTrade đều không được phép.
Xin vui lòng liên hệ với pr@teletrade.global nếu có câu hỏi.
ngân hàng