- Phân tích
- Tin tức và các công cụ
- Tin tức thị trường
- Silver Price Analysis: XAG/USD pulls back as dark cloud cover loom
Silver Price Analysis: XAG/USD pulls back as dark cloud cover loom
- Silver retreats to $28.09, unable to hold above the crucial $29 mark, indicating potential further declines.
- The 'dark cloud cover' technical pattern suggests vulnerability and possible downward movement.
- Focus remains on silver's ability to sustain above the $28.00 threshold, with key support and resistance levels closely watched.
Silver prices retreat from daily highs reached $29.01, dropping 2.63%, affected by high US Treasury yields, and stirring resistance around the $29.00 threshold. The XAG/USD trades at $28.09, breaking key support levels on its way toward current spot prices.
XAG/USD Price Analysis: Technical outlook
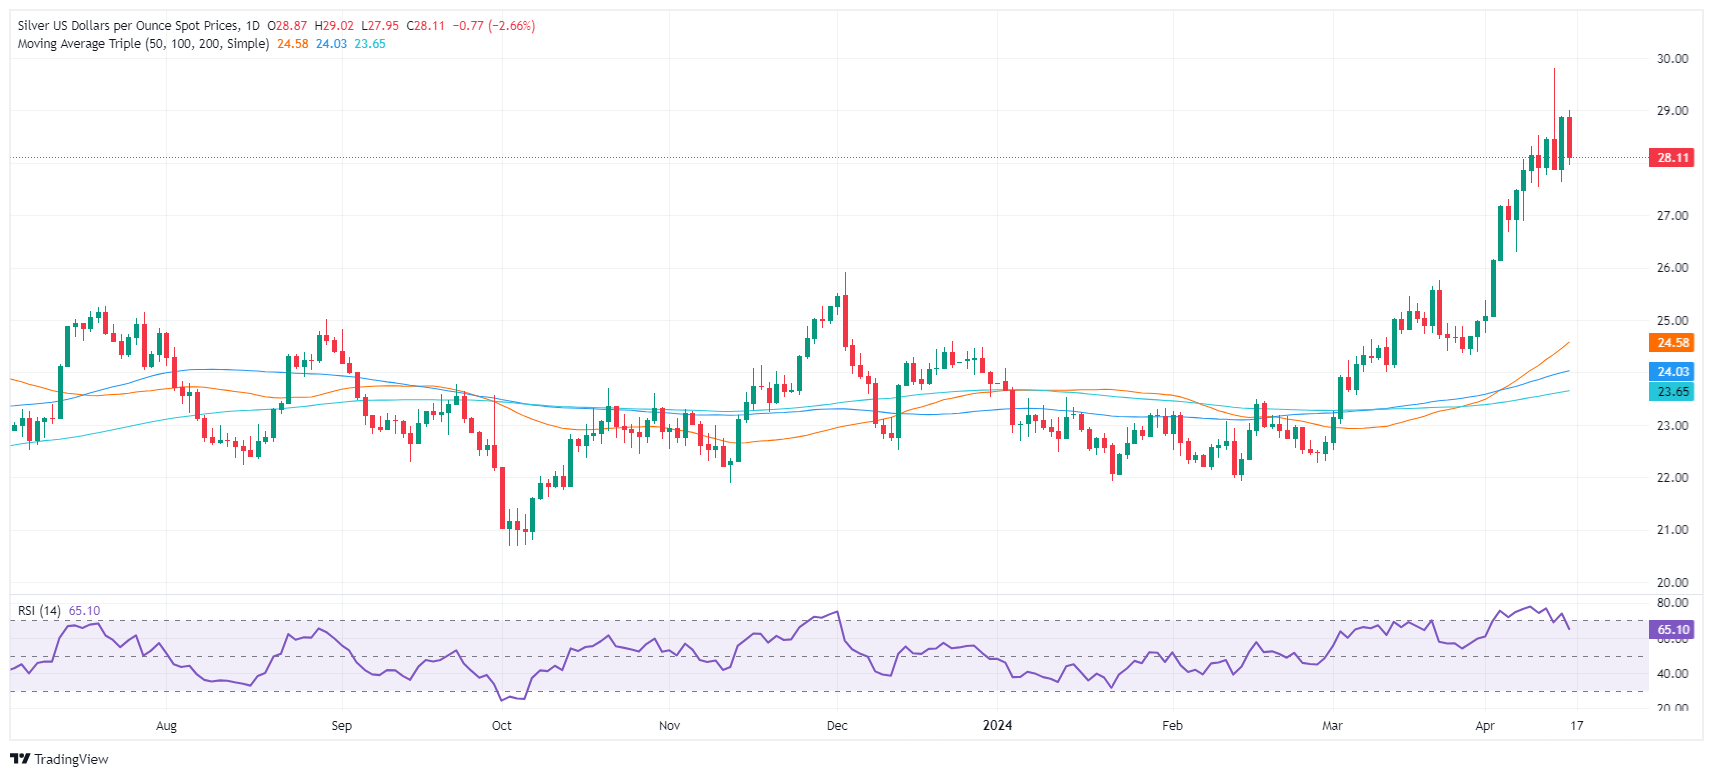
From a technical standpoint, XAG/USD buyers failed to hold Siver’s quote above the psychological $29.00 level after reaching a year-to-date (YTD) high of $29.79. That exacerbated the grey’s metal drop toward the $28.00 mark, opening the door for further downside. During the last couple of days, price action formed a ‘dark cloud cover’ that needs confirmation below the April 15 low of $27.59.
Momentum was extremely bullish, though the Relative Strength Index (RSI) exited from overbought conditions during the day, sponsoring a leg-down on Silver. That said, XAG/USD could witness a pullback before buyers attempt to challenge the $29.00 mark.
Given the backdrop, Siver’s first support would be $27.59, followed by the $27.00 mark. Further losses are seen at $26.29, the April 5 low. On the flip side, if buyers keep the XAG/USD spot price above $28.00, the next resistance levels are seen at the June 10, 2021, high at $28.28, followed by the May 18, 2021 high at $28.74.
XAG/USD Price Action – Daily Chart


© 2000-2026. Bản quyền Teletrade.
Trang web này được quản lý bởi Teletrade D.J. LLC 2351 LLC 2022 (Euro House, Richmond Hill Road, Kingstown, VC0100, St. Vincent and the Grenadines).
Thông tin trên trang web không phải là cơ sở để đưa ra quyết định đầu tư và chỉ được cung cấp cho mục đích làm quen.
Giao dịch trên thị trường tài chính (đặc biệt là giao dịch sử dụng các công cụ biên) mở ra những cơ hội lớn và tạo điều kiện cho các nhà đầu tư sẵn sàng mạo hiểm để thu lợi nhuận, tuy nhiên nó mang trong mình nguy cơ rủi ro khá cao. Chính vì vậy trước khi tiến hành giao dịch cần phải xem xét mọi mặt vấn đề chấp nhận tiến hành giao dịch cụ thể xét theo quan điểm của nguồn lực tài chính sẵn có và mức độ am hiểu thị trường tài chính.
Sử dụng thông tin: sử dụng toàn bộ hay riêng biệt các dữ liệu trên trang web của công ty TeleTrade như một nguồn cung cấp thông tin nhất định. Việc sử dụng tư liệu từ trang web cần kèm theo liên kết đến trang teletrade.vn. Việc tự động thu thập số liệu cũng như thông tin từ trang web TeleTrade đều không được phép.
Xin vui lòng liên hệ với pr@teletrade.global nếu có câu hỏi.
ngân hàng