- Phân tích
- Tin tức và các công cụ
- Tin tức thị trường
- AUD/JPY Price Analysis: Bulls must regain the 20-day SMA to avoid further losses
AUD/JPY Price Analysis: Bulls must regain the 20-day SMA to avoid further losses
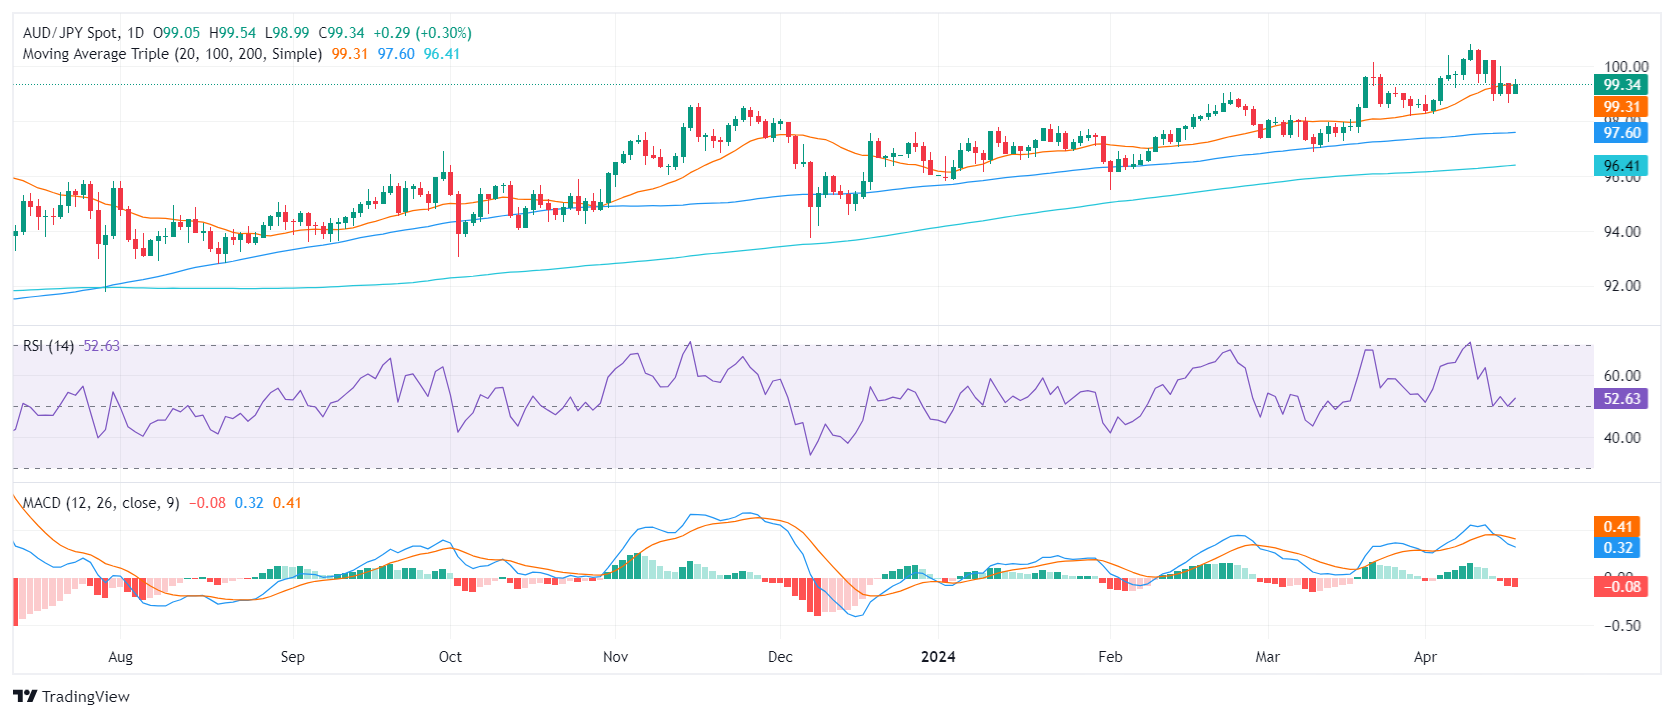
- The daily RSI for the AUD/JPY demonstrates a modest uptrend, maintaining above the middle ground.
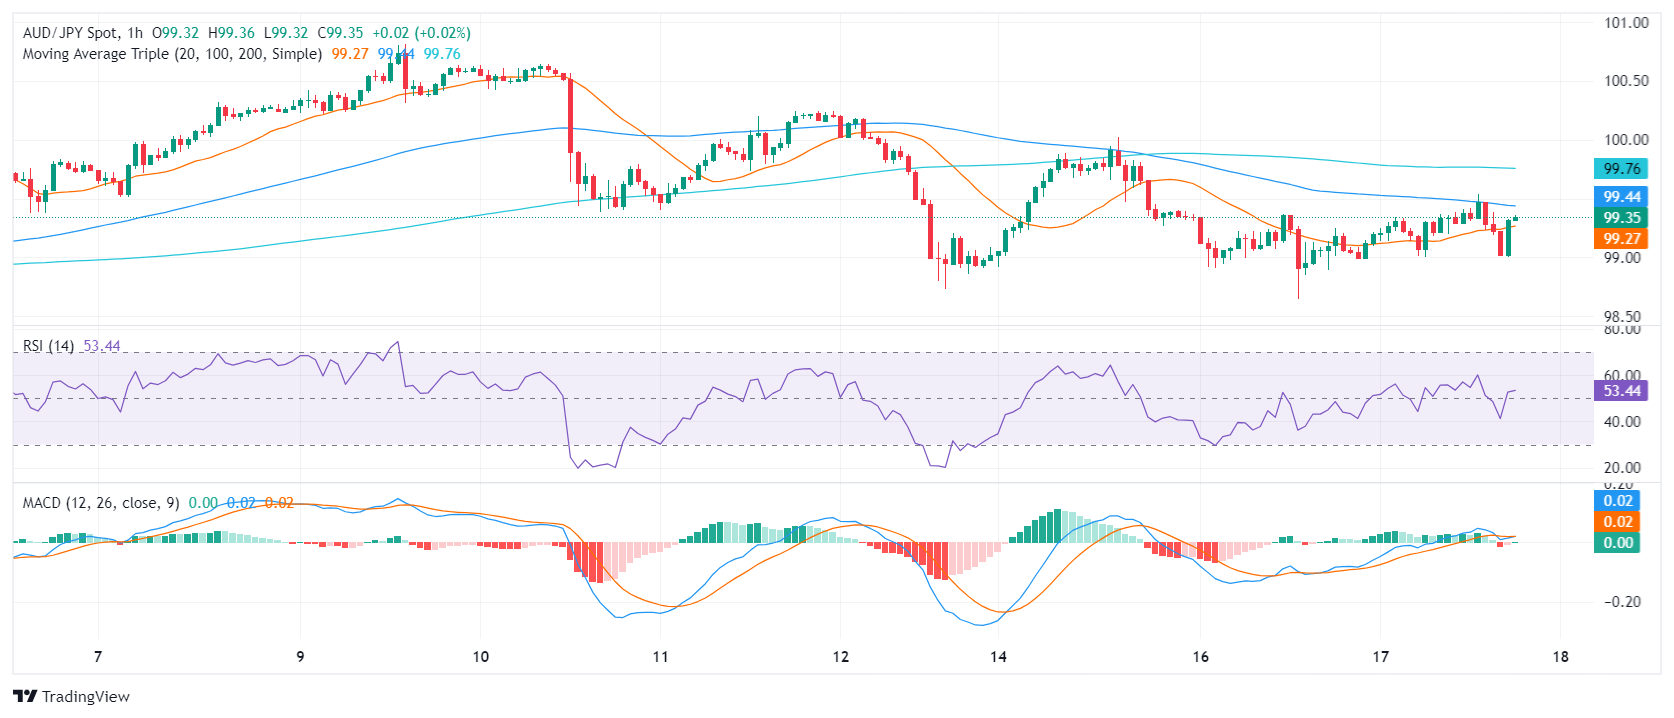
- The Hourly chart reveals mixed sentiment, with frequent RSI changes and negative momentum portrayed by the MACD bars.
- The 20-day SMA at 99.30 is the main target for the bulls.
The AUD/JPY showed a stronger stance by posting a gain of 0.27% and settling at 99.24 in Wednesday’s session. Despite the recent downside, the pair indicates a dominant bullish outlook, firmly standing above the key Simple Moving Averages (SMAs). However, the recent dip below the 20-day SMA brightened the outlook for the bears for the short term.
On the daily chart, the Relative Strength Index (RSI) pair indicates a slight positive trend. Despite dipping close to the 50 level, it recovered and retained its position in positive territory, hovering around 52. Meanwhile, the Moving Average Convergence Divergence (MACD) shows rising red bars, signaling a potential shift in momentum.
AUD/JPY daily chart
The hourly RSI reveals a mixed trend. The latest reading was 53, indicating a positive trend, while previous readings varied between positive and negative territories, revealing fluctuating market momentum. The hourly MACD shows flat red bars, signifying a steady negative momentum.
AUD/JPY hourly chart
Observing the broader prospect, the AUD/JPY's position above the 100-day and 200-day SMA reveals a robust long-term bullish trend. Any significant movements today that keep the cross above these levels won’t threaten the positive outlook, but as the bears gather momentum, some downside in the short term should be expected.


© 2000-2026. Bản quyền Teletrade.
Trang web này được quản lý bởi Teletrade D.J. LLC 2351 LLC 2022 (Euro House, Richmond Hill Road, Kingstown, VC0100, St. Vincent and the Grenadines).
Thông tin trên trang web không phải là cơ sở để đưa ra quyết định đầu tư và chỉ được cung cấp cho mục đích làm quen.
Giao dịch trên thị trường tài chính (đặc biệt là giao dịch sử dụng các công cụ biên) mở ra những cơ hội lớn và tạo điều kiện cho các nhà đầu tư sẵn sàng mạo hiểm để thu lợi nhuận, tuy nhiên nó mang trong mình nguy cơ rủi ro khá cao. Chính vì vậy trước khi tiến hành giao dịch cần phải xem xét mọi mặt vấn đề chấp nhận tiến hành giao dịch cụ thể xét theo quan điểm của nguồn lực tài chính sẵn có và mức độ am hiểu thị trường tài chính.
Sử dụng thông tin: sử dụng toàn bộ hay riêng biệt các dữ liệu trên trang web của công ty TeleTrade như một nguồn cung cấp thông tin nhất định. Việc sử dụng tư liệu từ trang web cần kèm theo liên kết đến trang teletrade.vn. Việc tự động thu thập số liệu cũng như thông tin từ trang web TeleTrade đều không được phép.
Xin vui lòng liên hệ với pr@teletrade.global nếu có câu hỏi.
ngân hàng