- Phân tích
- Tin tức và các công cụ
- Tin tức thị trường
- NZD/USD Price Analysis: Downward trend likely to continue despite indicators recovering
NZD/USD Price Analysis: Downward trend likely to continue despite indicators recovering
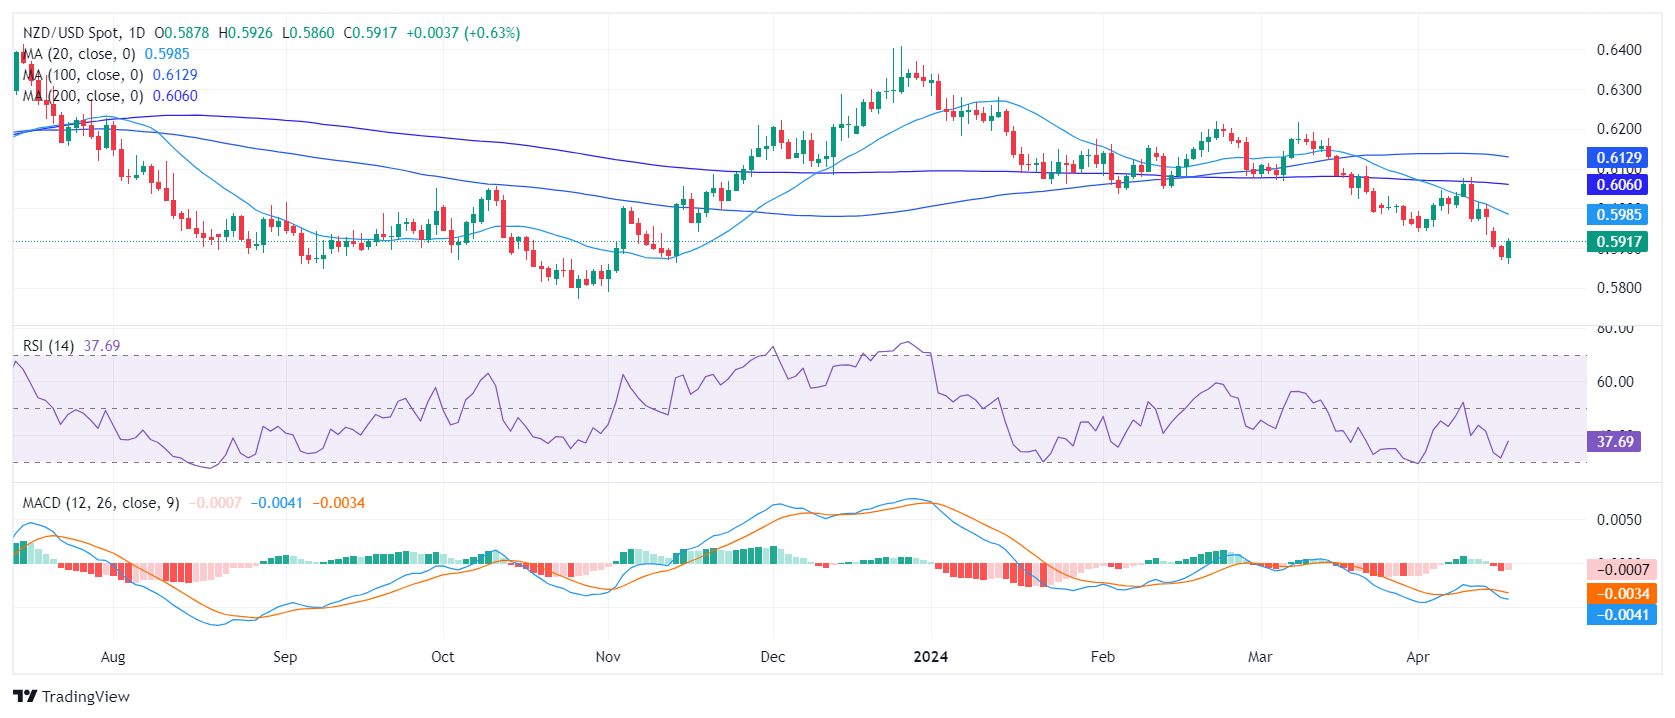
- The RSI on the daily chart lies deep in negative terrain but recovered.
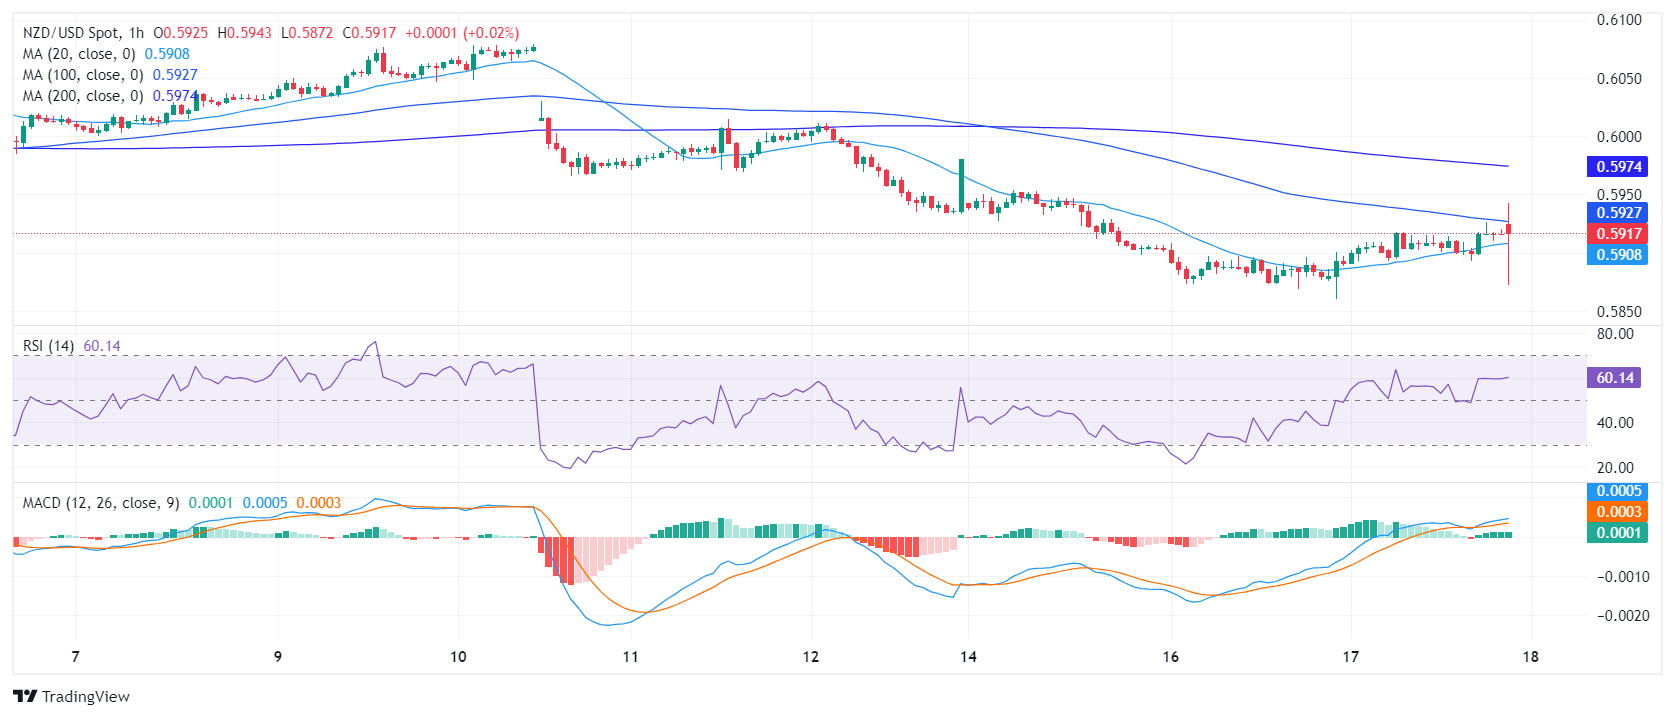
- The hourly RSI paints a growing buying momentum, trending the positive territory.
- The MACD on both charts signals a less intense selling momentum.
The NZD/USD stands recovered to 0.5919, it seeing 0.60% gains. The dominant sentiment remains bearish, subtly dominated by sellers due to the consistent positioning beneath key Simple Moving Averages (SMAs). However, indicators on the daily and hourly charts seem to be recovering.
On the daily chart, the Relative Strength Index (RSI) demonstrates a negative sentiment as it continues an under-50 trend. Although there was a slight uptick from the recent low point seen on Monday, the RSI remains in deep in negative territory. Moreover, the Moving Average Convergence Divergence (MACD) displays falling red bars, reinforcing a weakening bearish momentum.
NZD/USD daily chart
The hourly chart presents an interesting contrast. Here, recent RSI readings consistently float above 50, marking a positive territory. The latest reading is 57, revealing that buyers are taking the reins on the hourly scale. The MACD histogram echoes the buying momentum printing rising green bars.
NZD/USD hourly chart
Upon examining the long-term trend, it becomes apparent that the NZD/USD exhibits bearish momentum as it slots below the 20-day, 100-day, and 200-day Simple Moving Average (SMA) indicators. So any movements which keeps the pair beneath these levels shouldn't be considered as a clear buying signal.


© 2000-2026. Bản quyền Teletrade.
Trang web này được quản lý bởi Teletrade D.J. LLC 2351 LLC 2022 (Euro House, Richmond Hill Road, Kingstown, VC0100, St. Vincent and the Grenadines).
Thông tin trên trang web không phải là cơ sở để đưa ra quyết định đầu tư và chỉ được cung cấp cho mục đích làm quen.
Giao dịch trên thị trường tài chính (đặc biệt là giao dịch sử dụng các công cụ biên) mở ra những cơ hội lớn và tạo điều kiện cho các nhà đầu tư sẵn sàng mạo hiểm để thu lợi nhuận, tuy nhiên nó mang trong mình nguy cơ rủi ro khá cao. Chính vì vậy trước khi tiến hành giao dịch cần phải xem xét mọi mặt vấn đề chấp nhận tiến hành giao dịch cụ thể xét theo quan điểm của nguồn lực tài chính sẵn có và mức độ am hiểu thị trường tài chính.
Sử dụng thông tin: sử dụng toàn bộ hay riêng biệt các dữ liệu trên trang web của công ty TeleTrade như một nguồn cung cấp thông tin nhất định. Việc sử dụng tư liệu từ trang web cần kèm theo liên kết đến trang teletrade.vn. Việc tự động thu thập số liệu cũng như thông tin từ trang web TeleTrade đều không được phép.
Xin vui lòng liên hệ với pr@teletrade.global nếu có câu hỏi.
ngân hàng