- Phân tích
- Tin tức và các công cụ
- Tin tức thị trường
- EUR/JPY Price Analysis: Bulls Maintain Control, consolidation phase likely
EUR/JPY Price Analysis: Bulls Maintain Control, consolidation phase likely
- The RSI on the daily chart of EUR/JPY indicates sustained bullish momentum.
- Hourly chart shows an RSI below its mid-zone and MACD with rising red bars, pointing towards possible consolidation.
- The EUR/JPY's position above main SMAs underscores a strong bullish bias.
The EUR/JPY slightly declined to 164.70 in Thursday’s session. That being said, the overall trend still favors the bulls but a consolidation phase, suggested by bears dominating the hourly chart, may create a balanced playing field for both buyers and sellers ahead of the Asian session.
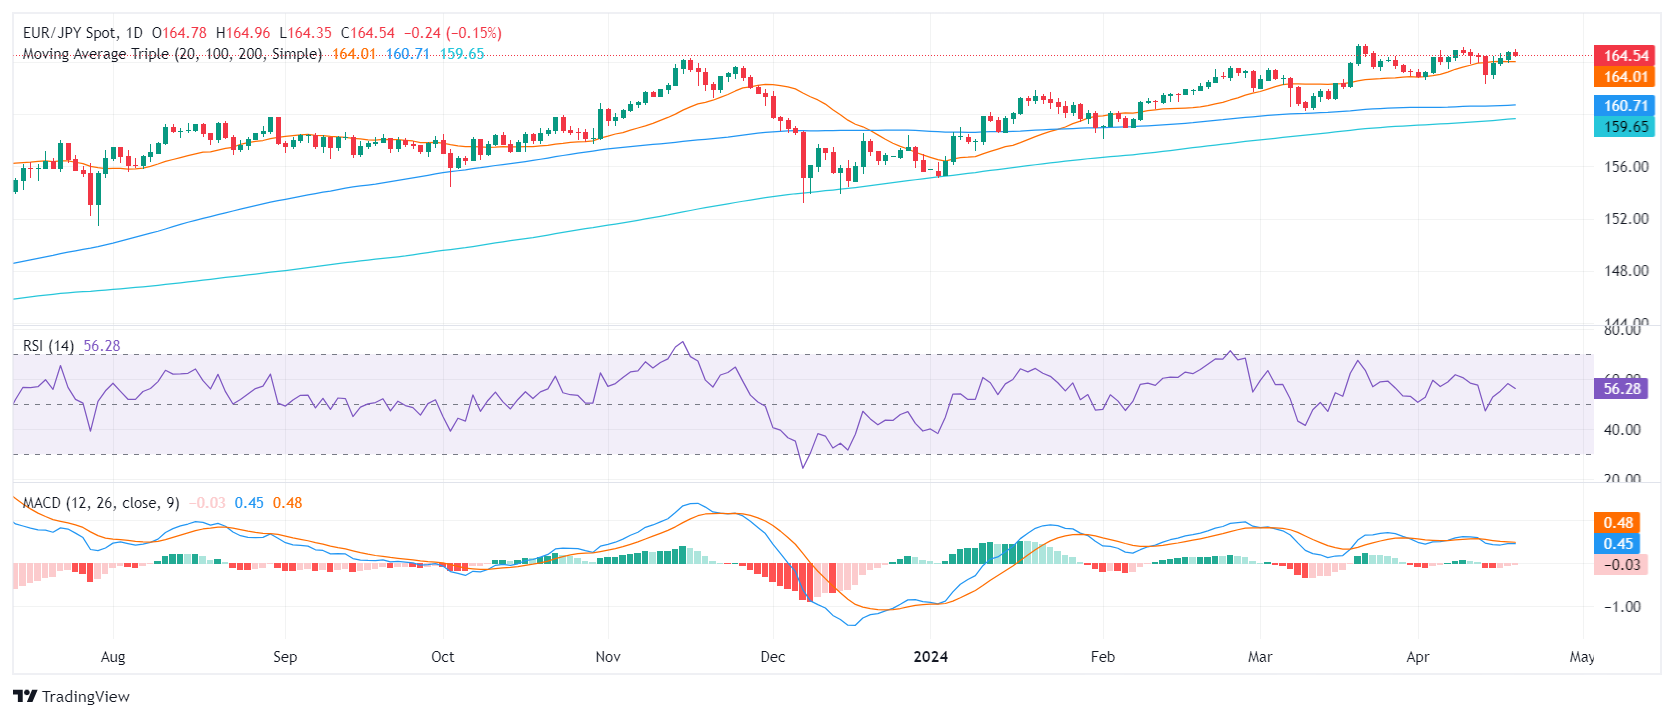
On the daily chart, the Relative Strength Index (RSI) for the EUR/JPY pair is in positive territory, with a most recent reading of 58. This suggests that the pair's upsurge might remain intact as long as the RSI stays above the 50 mark, indicating that buyers are in control at this moment.
EUR/JPY daily chart
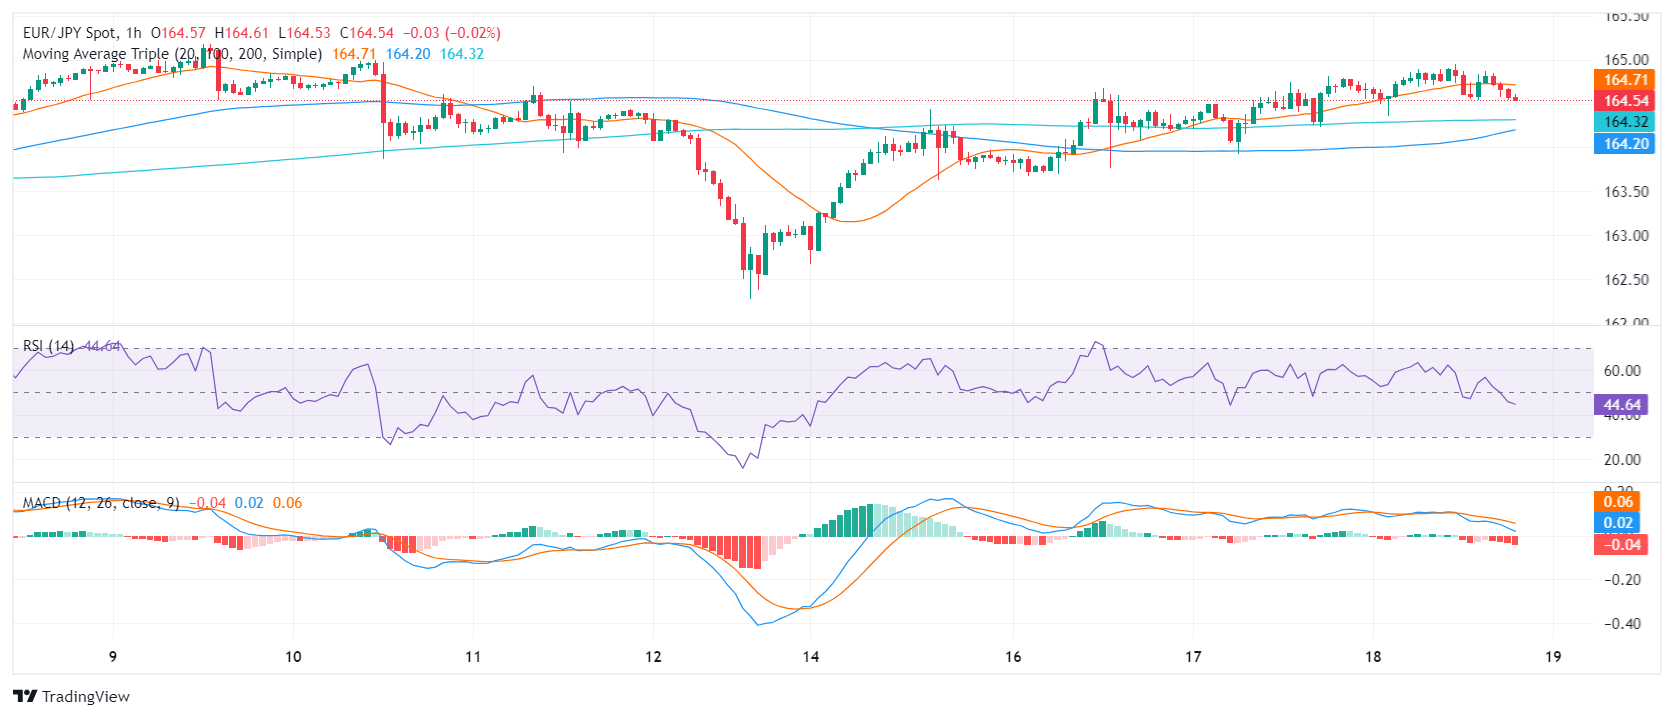
Meanwhile, on the hourly chart, the EUR/JPY's RSI declined below its middle zone, with the latest reading of 44 as of the last hour. This could point towards a pending period of consolidation. The Moving Average Convergence Divergence (MACD) displays rising red bars, also hinting at a temporary slowdown in the bullish momentum.
EUR/JPY hourly chart
Regarding the Simple Moving Average (SMA), the cross EUR/JPY holds strong above its 20, 100, and 200-day SMAs, indicating a bullish stance. That being said the pair must defend the 20-day SMA at 164.00 which is a strong support to maintain the positive short-term outlook.


© 2000-2026. Bản quyền Teletrade.
Trang web này được quản lý bởi Teletrade D.J. LLC 2351 LLC 2022 (Euro House, Richmond Hill Road, Kingstown, VC0100, St. Vincent and the Grenadines).
Thông tin trên trang web không phải là cơ sở để đưa ra quyết định đầu tư và chỉ được cung cấp cho mục đích làm quen.
Giao dịch trên thị trường tài chính (đặc biệt là giao dịch sử dụng các công cụ biên) mở ra những cơ hội lớn và tạo điều kiện cho các nhà đầu tư sẵn sàng mạo hiểm để thu lợi nhuận, tuy nhiên nó mang trong mình nguy cơ rủi ro khá cao. Chính vì vậy trước khi tiến hành giao dịch cần phải xem xét mọi mặt vấn đề chấp nhận tiến hành giao dịch cụ thể xét theo quan điểm của nguồn lực tài chính sẵn có và mức độ am hiểu thị trường tài chính.
Sử dụng thông tin: sử dụng toàn bộ hay riêng biệt các dữ liệu trên trang web của công ty TeleTrade như một nguồn cung cấp thông tin nhất định. Việc sử dụng tư liệu từ trang web cần kèm theo liên kết đến trang teletrade.vn. Việc tự động thu thập số liệu cũng như thông tin từ trang web TeleTrade đều không được phép.
Xin vui lòng liên hệ với pr@teletrade.global nếu có câu hỏi.
ngân hàng