- Phân tích
- Tin tức và các công cụ
- Tin tức thị trường
- NZD/JPY Price Analysis: Buyers dominance diminishes, market could favor sellers soon
NZD/JPY Price Analysis: Buyers dominance diminishes, market could favor sellers soon
- The daily RSI shows that buyers' hold over the market is likely fading, signaling the growing presence of sellers.
- On the hourly chart, indicators underline a prominent seller command in the past sessions.
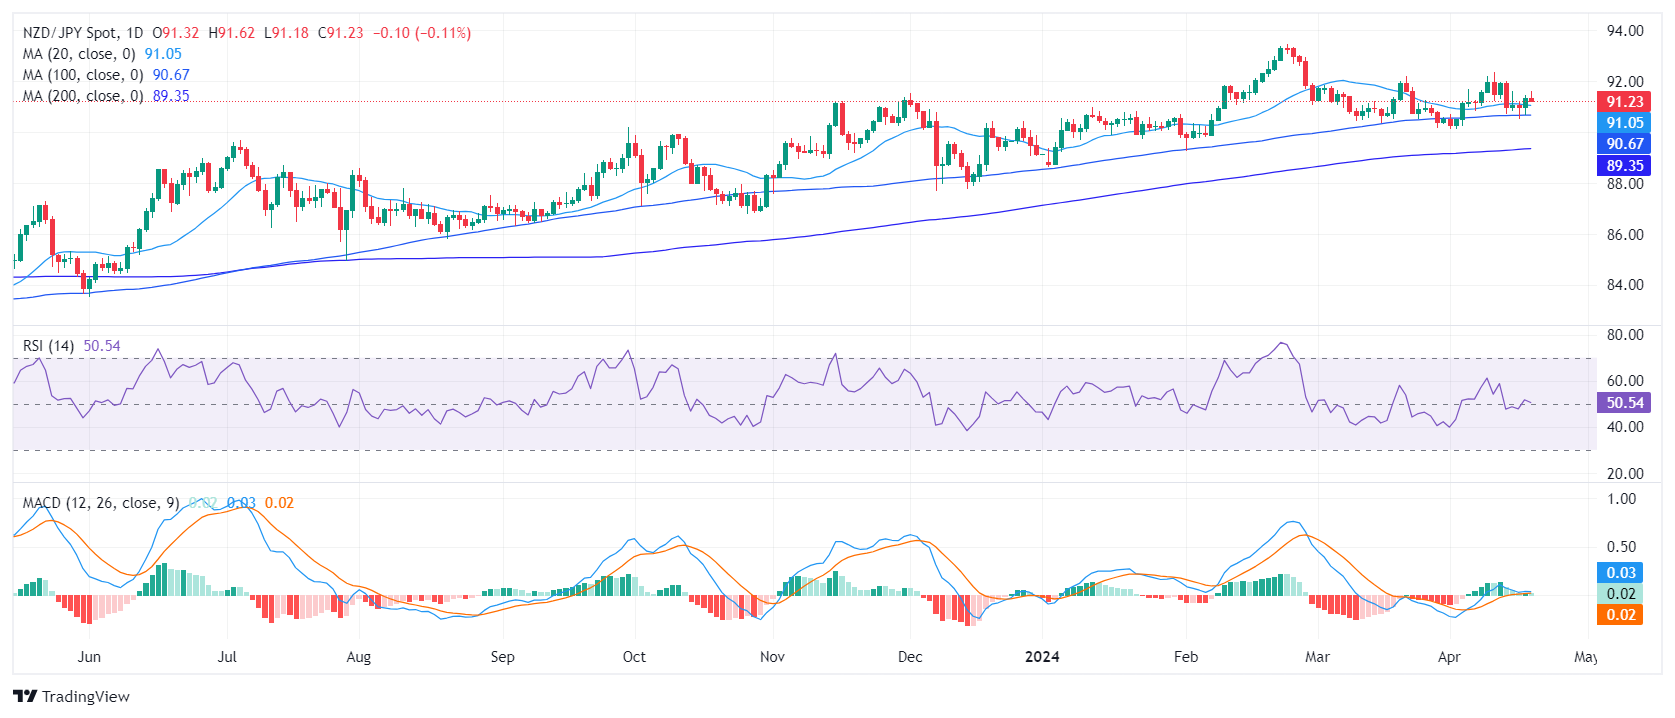
The NZD/JPY is trading slightly lower at around 91.23. It seems the firm grip buyers had over the market is dwindling, yet the pair doggedly persists above crucial Simple Moving Averages (SMAs). Market watchers should eye the short-term trajectory of the NZD/JPY for any potential shifts that could give sellers the upper hand. Specifically, if bears breach the 20-day Simple Moving Average (SMA) at 91.00.
On the daily RSI fluctuates around the positive region but is currently pointing down. This, combined with the rising red bars trend in the MACD (Moving Average Converge Divergence) histogram, indicates that buyer dominance is fading and the market could begin favoring sellers soon.
NZD/JPY daily chart
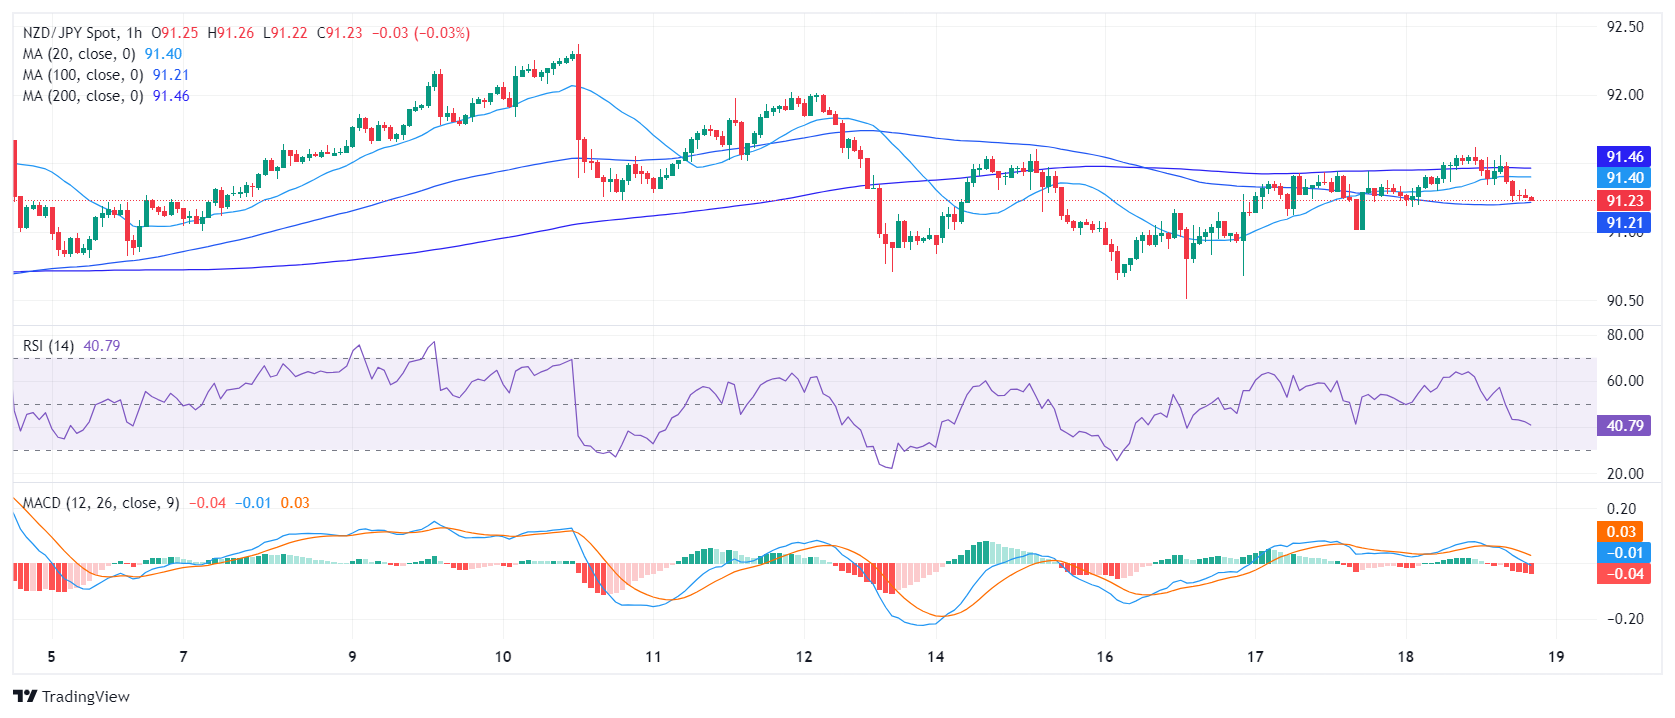
In addition, the hourly Relative Strength Index (RSI) hovers below the neutral 50 line, reflecting a dominant presence of sellers in the recent sessions. The negative thrust is confirmed by the MACD, which reveals decreasing green bars, indicating diminishing positive momentum.
NZD/JPY hourly chart
Upon evaluating the broader landscape, the NZD/JPY is currently hovering above its key Simple Moving Averages (SMAs), reflecting continued buying pressure thereby sustaining the long-term uptrend. However, the pair closely challenges the 20-day SMA, suggesting potential for further downward movements if this level doesn’t hold. Moreover, the pair maintaining a stance above the 100 and 200-day SMAs reinforces a long-term bullish view.


© 2000-2026. Bản quyền Teletrade.
Trang web này được quản lý bởi Teletrade D.J. LLC 2351 LLC 2022 (Euro House, Richmond Hill Road, Kingstown, VC0100, St. Vincent and the Grenadines).
Thông tin trên trang web không phải là cơ sở để đưa ra quyết định đầu tư và chỉ được cung cấp cho mục đích làm quen.
Giao dịch trên thị trường tài chính (đặc biệt là giao dịch sử dụng các công cụ biên) mở ra những cơ hội lớn và tạo điều kiện cho các nhà đầu tư sẵn sàng mạo hiểm để thu lợi nhuận, tuy nhiên nó mang trong mình nguy cơ rủi ro khá cao. Chính vì vậy trước khi tiến hành giao dịch cần phải xem xét mọi mặt vấn đề chấp nhận tiến hành giao dịch cụ thể xét theo quan điểm của nguồn lực tài chính sẵn có và mức độ am hiểu thị trường tài chính.
Sử dụng thông tin: sử dụng toàn bộ hay riêng biệt các dữ liệu trên trang web của công ty TeleTrade như một nguồn cung cấp thông tin nhất định. Việc sử dụng tư liệu từ trang web cần kèm theo liên kết đến trang teletrade.vn. Việc tự động thu thập số liệu cũng như thông tin từ trang web TeleTrade đều không được phép.
Xin vui lòng liên hệ với pr@teletrade.global nếu có câu hỏi.
ngân hàng