- Phân tích
- Tin tức và các công cụ
- Tin tức thị trường
- EUR/JPY Price Analysis: Bullish push persists, eyes on waning momentum
EUR/JPY Price Analysis: Bullish push persists, eyes on waning momentum
- Flattening indicators on the daily chart may signal a period of consolidation.
- The flat RSI slope and falling MACD bars on the hourly chart translate into a neutral sentiment for the session.
The EUR/JPY currency pair stands at 164.71, reflecting a persistent bullish upsurge as it cleared daily losses and defended the 20-day Simple Moving Averages (SMA). However, caution is warranted considering the shifting market environment as the flattening momentum, revealed on the daily and hourly chart may cool down the bullish outlook.
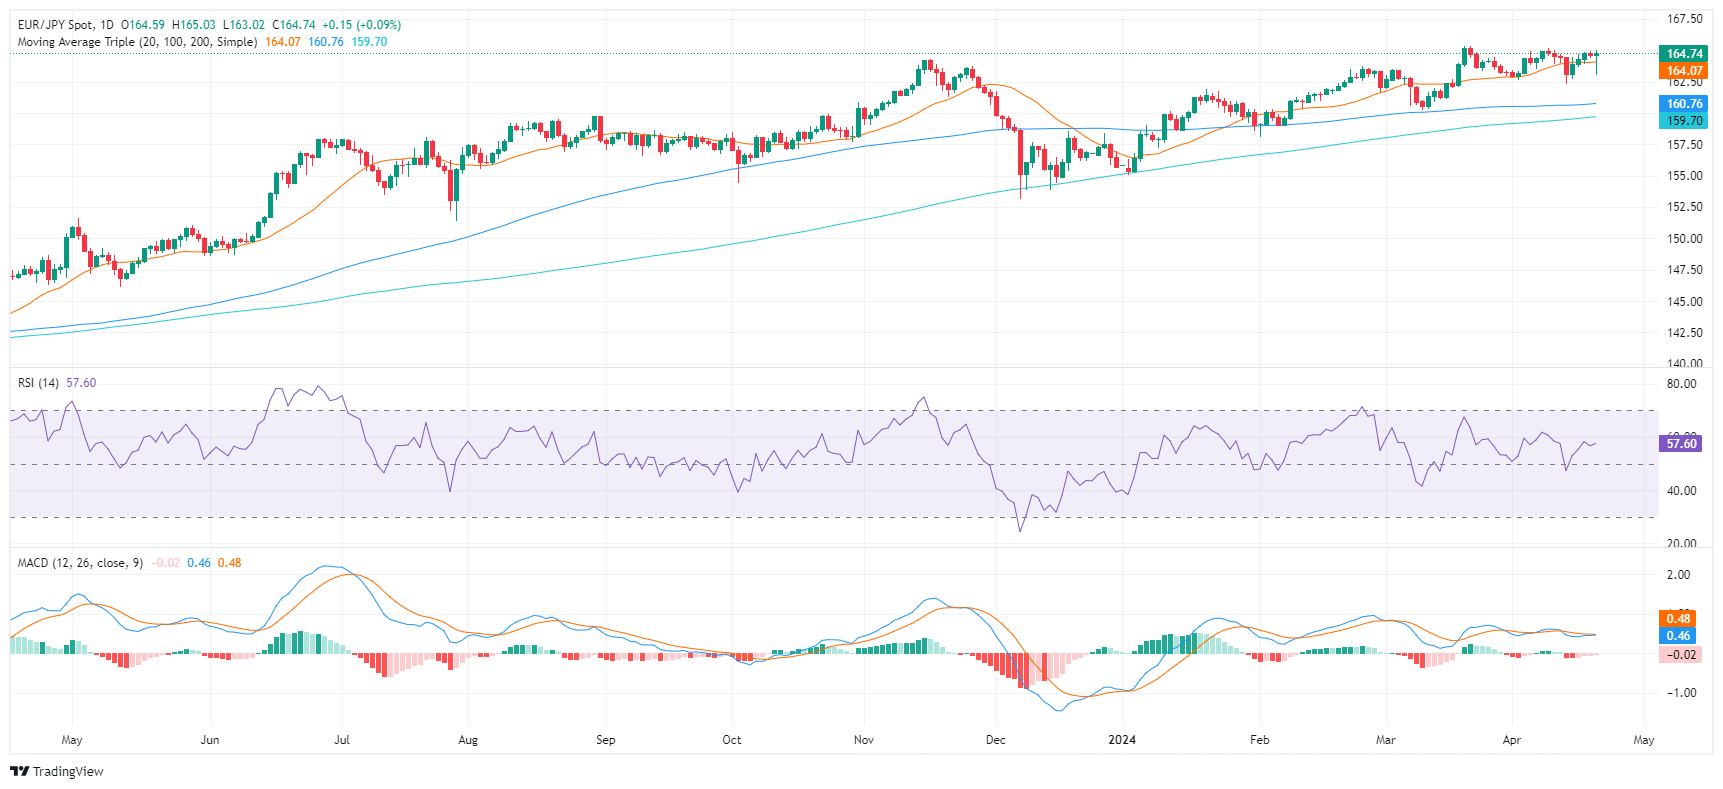
On the daily chart, the Relative Strength Index (RSI) pair is trending positive, at 58 but flattened. Simultaneously, the Moving Average Convergence Divergence (MACD) reveals red bars, hinting at a steady selling pressure.
EUR/JPY daily chart
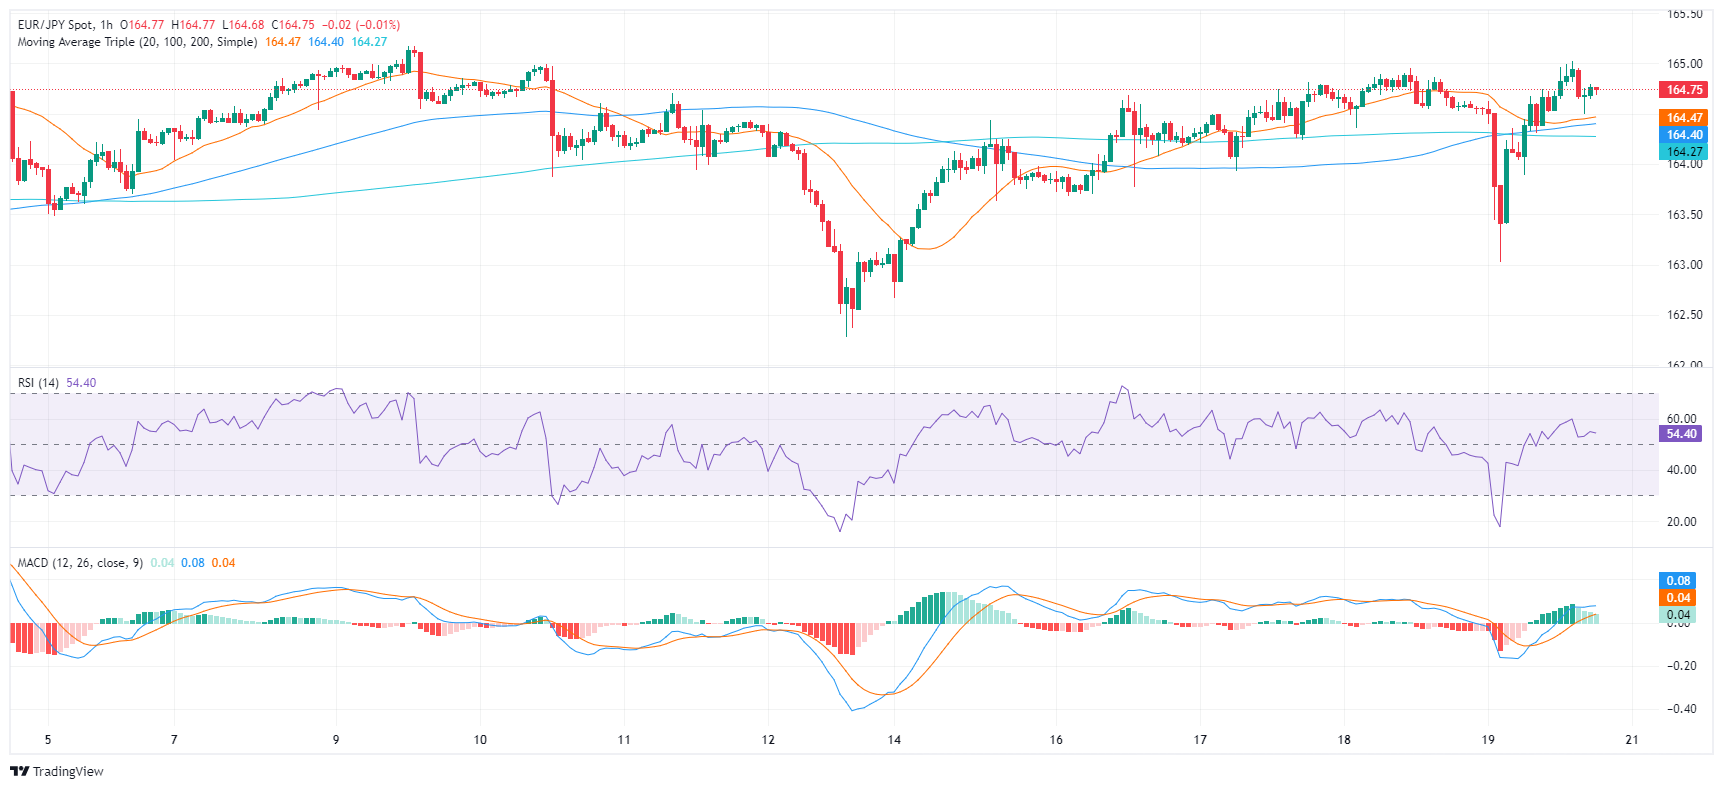
Taking into account the hourly chart, the latest RSI value is just above the middle ground at 53, also with a flat slope. This signifies neutrality within the market. Meanwhile, the MACD decreasing green bars, signaling a potential slowdown in the upward pressure.
EUR/JPY hourly chart
In light of the recent market conditions, the EUR/JPY lies above its 20,100, and 200-day SMA, depicting a sturdy ascending pattern in its broader outlook. It suggests the pair have shown resilience in maintaining the bullish momentum both from a short-term and long-term perspective. On Friday, the cross held onto the 20-day SMA at 164.00, suggesting that the bulls remain resilient. Essentially, if the pair continues to stay above the SMA's, it could extend its upward trajectory, enhancing its technical stance in the forthcoming sessions.


© 2000-2026. Bản quyền Teletrade.
Trang web này được quản lý bởi Teletrade D.J. LLC 2351 LLC 2022 (Euro House, Richmond Hill Road, Kingstown, VC0100, St. Vincent and the Grenadines).
Thông tin trên trang web không phải là cơ sở để đưa ra quyết định đầu tư và chỉ được cung cấp cho mục đích làm quen.
Giao dịch trên thị trường tài chính (đặc biệt là giao dịch sử dụng các công cụ biên) mở ra những cơ hội lớn và tạo điều kiện cho các nhà đầu tư sẵn sàng mạo hiểm để thu lợi nhuận, tuy nhiên nó mang trong mình nguy cơ rủi ro khá cao. Chính vì vậy trước khi tiến hành giao dịch cần phải xem xét mọi mặt vấn đề chấp nhận tiến hành giao dịch cụ thể xét theo quan điểm của nguồn lực tài chính sẵn có và mức độ am hiểu thị trường tài chính.
Sử dụng thông tin: sử dụng toàn bộ hay riêng biệt các dữ liệu trên trang web của công ty TeleTrade như một nguồn cung cấp thông tin nhất định. Việc sử dụng tư liệu từ trang web cần kèm theo liên kết đến trang teletrade.vn. Việc tự động thu thập số liệu cũng như thông tin từ trang web TeleTrade đều không được phép.
Xin vui lòng liên hệ với pr@teletrade.global nếu có câu hỏi.
ngân hàng