- Phân tích
- Tin tức và các công cụ
- Tin tức thị trường
- NZD/JPY Price Analysis: Bearish momentum strengthens as sellers reclaim the 20-day SMA
NZD/JPY Price Analysis: Bearish momentum strengthens as sellers reclaim the 20-day SMA
- The daily chart of the NZD/JPY indicates a weakening momentum, with RSI and MACD signifying rising selling pressure.
- The NZD/JPY plunged below the crucial short-term 20-day SMA, hinting at immediate bearish prospects.
- Despite recent bearish actions, the long-term outlook continues to favor buyers.
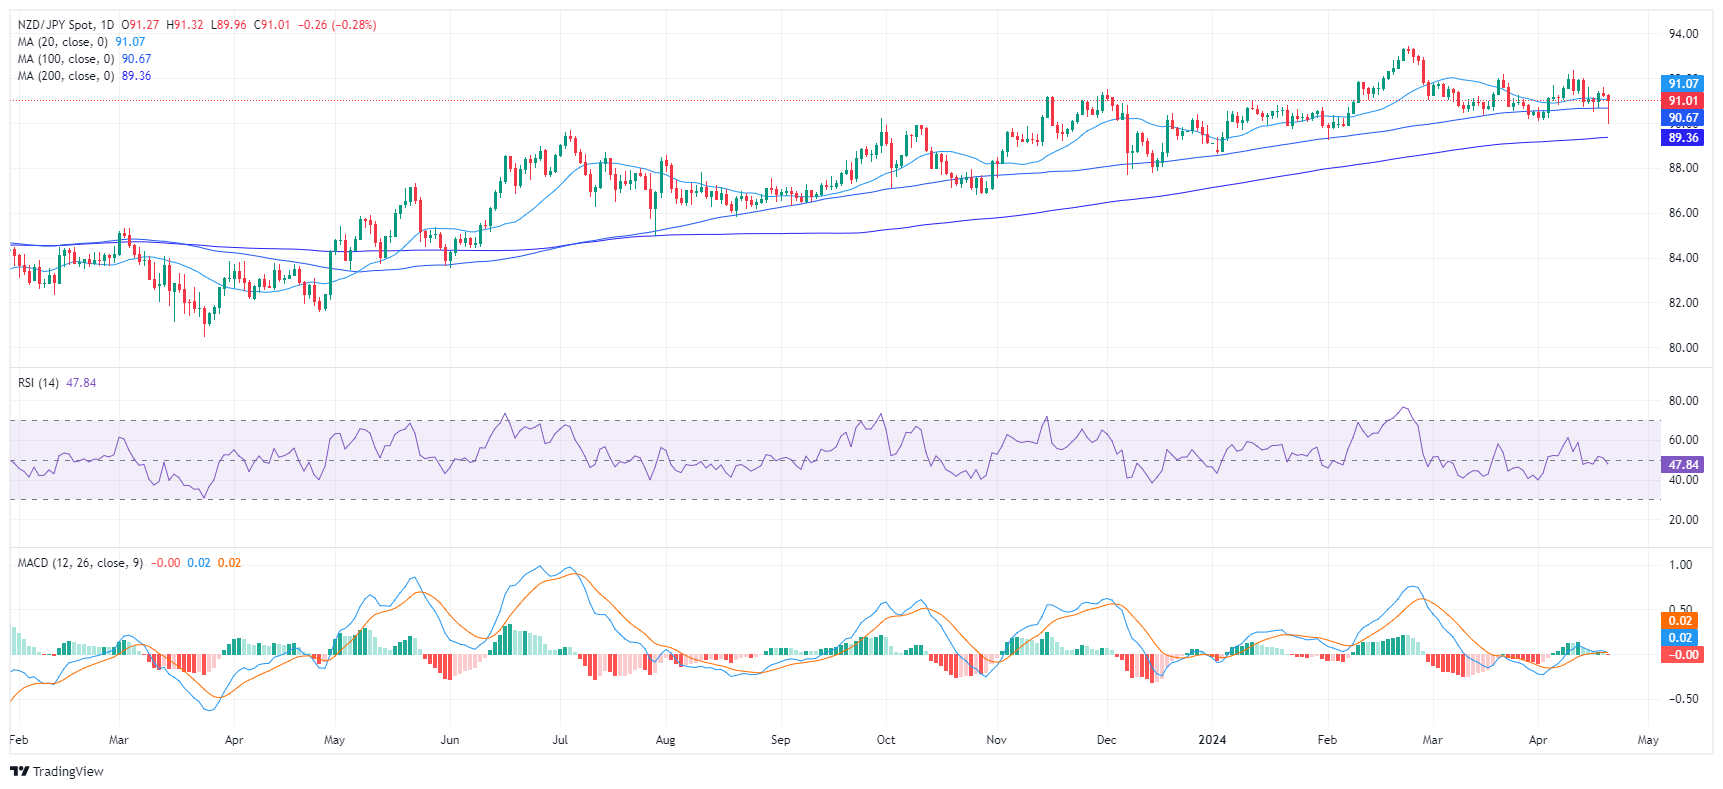
The NZD/JPY declined to 91.00, down by 0.27% on Friday. Bears are quietly gaining ground conquering the 20-day Simple Moving Average (SMA) and the selling traction is mounting. On the broader outlook, the trend is still bullish.
On the daily chart, the Relative Strength Index (RSI) pair reveals a recent drift into negative territory towards 47, indicating weakening momentum. Likewise, the Moving Average Convergence Divergence (MACD) paints a similar picture with a fresh red bar, signaling a growing bearish momentum. These indicators collectively imply sellers' dominance in the current market scenario.
NZD/JPY daily chart
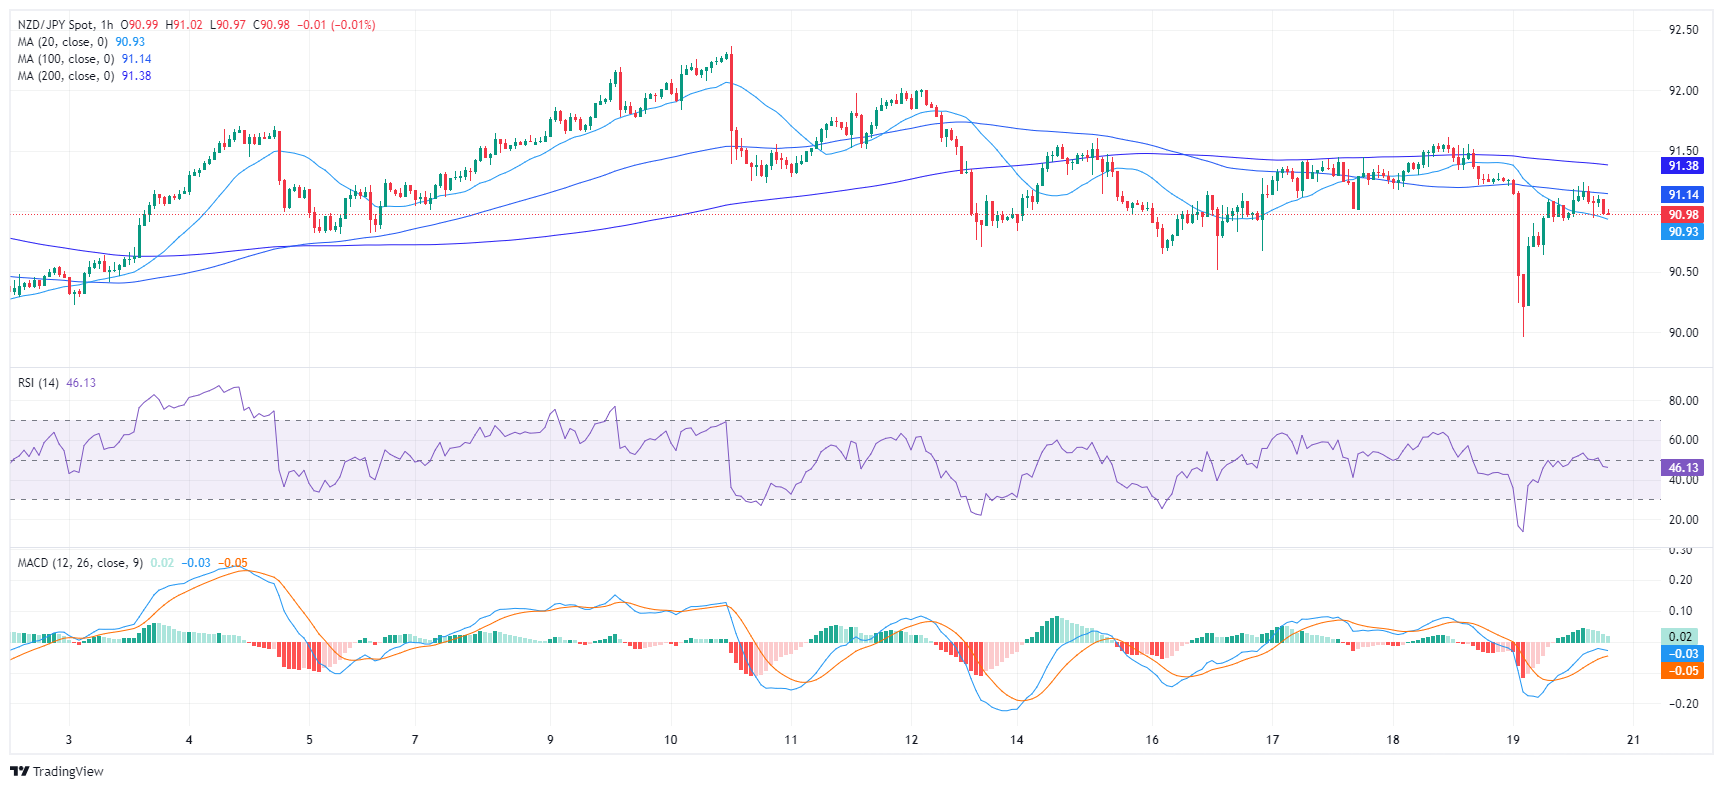
Upon examining the hourly chart, the RSI stands below its middle points, also adding arguments for a negative short-term outlook. In addition, the MACD histogram is printing decreasing green bars a clear indication of diminishing bullish momentum.
NZD/JPY hourly chart
When turning the lens to the broader landscape, NZD/JPY underwent substantial changes on Friday. The pair sunk beneath the 20-day Simple Moving Average (SMA), a significant short-term technical indicator, thus potentially establishing a bearish outlook in the immediate future. Despite this, the pair has managed to maintain its position above the 100-day and 200-day SMAs, revealing sustained bullish momentum over a more extended period. That being said, as bears gather ground, they might make a stride toward the 100-day SMA at around 90.60 which in case of conquering it, would worsen the outlook for the pair.


© 2000-2026. Bản quyền Teletrade.
Trang web này được quản lý bởi Teletrade D.J. LLC 2351 LLC 2022 (Euro House, Richmond Hill Road, Kingstown, VC0100, St. Vincent and the Grenadines).
Thông tin trên trang web không phải là cơ sở để đưa ra quyết định đầu tư và chỉ được cung cấp cho mục đích làm quen.
Giao dịch trên thị trường tài chính (đặc biệt là giao dịch sử dụng các công cụ biên) mở ra những cơ hội lớn và tạo điều kiện cho các nhà đầu tư sẵn sàng mạo hiểm để thu lợi nhuận, tuy nhiên nó mang trong mình nguy cơ rủi ro khá cao. Chính vì vậy trước khi tiến hành giao dịch cần phải xem xét mọi mặt vấn đề chấp nhận tiến hành giao dịch cụ thể xét theo quan điểm của nguồn lực tài chính sẵn có và mức độ am hiểu thị trường tài chính.
Sử dụng thông tin: sử dụng toàn bộ hay riêng biệt các dữ liệu trên trang web của công ty TeleTrade như một nguồn cung cấp thông tin nhất định. Việc sử dụng tư liệu từ trang web cần kèm theo liên kết đến trang teletrade.vn. Việc tự động thu thập số liệu cũng như thông tin từ trang web TeleTrade đều không được phép.
Xin vui lòng liên hệ với pr@teletrade.global nếu có câu hỏi.
ngân hàng