- Phân tích
- Tin tức và các công cụ
- Tin tức thị trường
- NZD/USD Price Analysis: Bearish trend prevails, potential for further declines expected
NZD/USD Price Analysis: Bearish trend prevails, potential for further declines expected
- The daily RSI for the NZD/USD reveals growing selling pressure, nearing oversold conditions.
- The hourly indicators also remain weak.
- The pair will close a 0.80% losing week.
The NZD/USD pair saw a 0.25% loss on Friday’s sessing and continues exhibiting a significant bearish tendency. Both short-term and long-term outlooks suggest the prevalence of sellers, which may signal that the pair is bound for further downside.
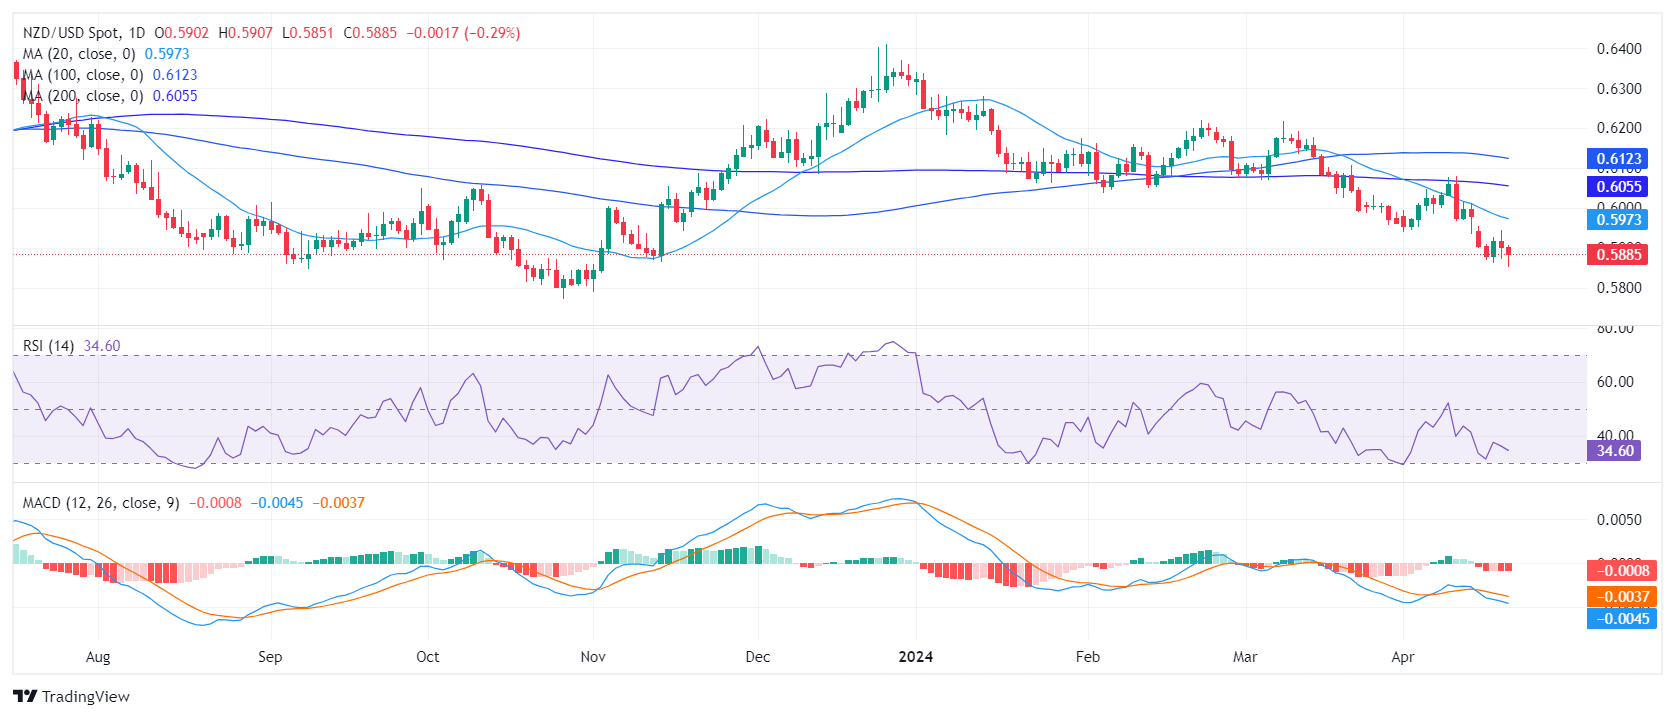
On the daily chart, the Relative Strength Index (RSI) indicates a bearish trend. It lies deep in negative terrain and edged near oversold territory. The escalating red bars on the Moving Average Convergence Divergence (MACD) histogram align with this bearish stance, augmenting this downturn prediction.
NZD/USD daily chart
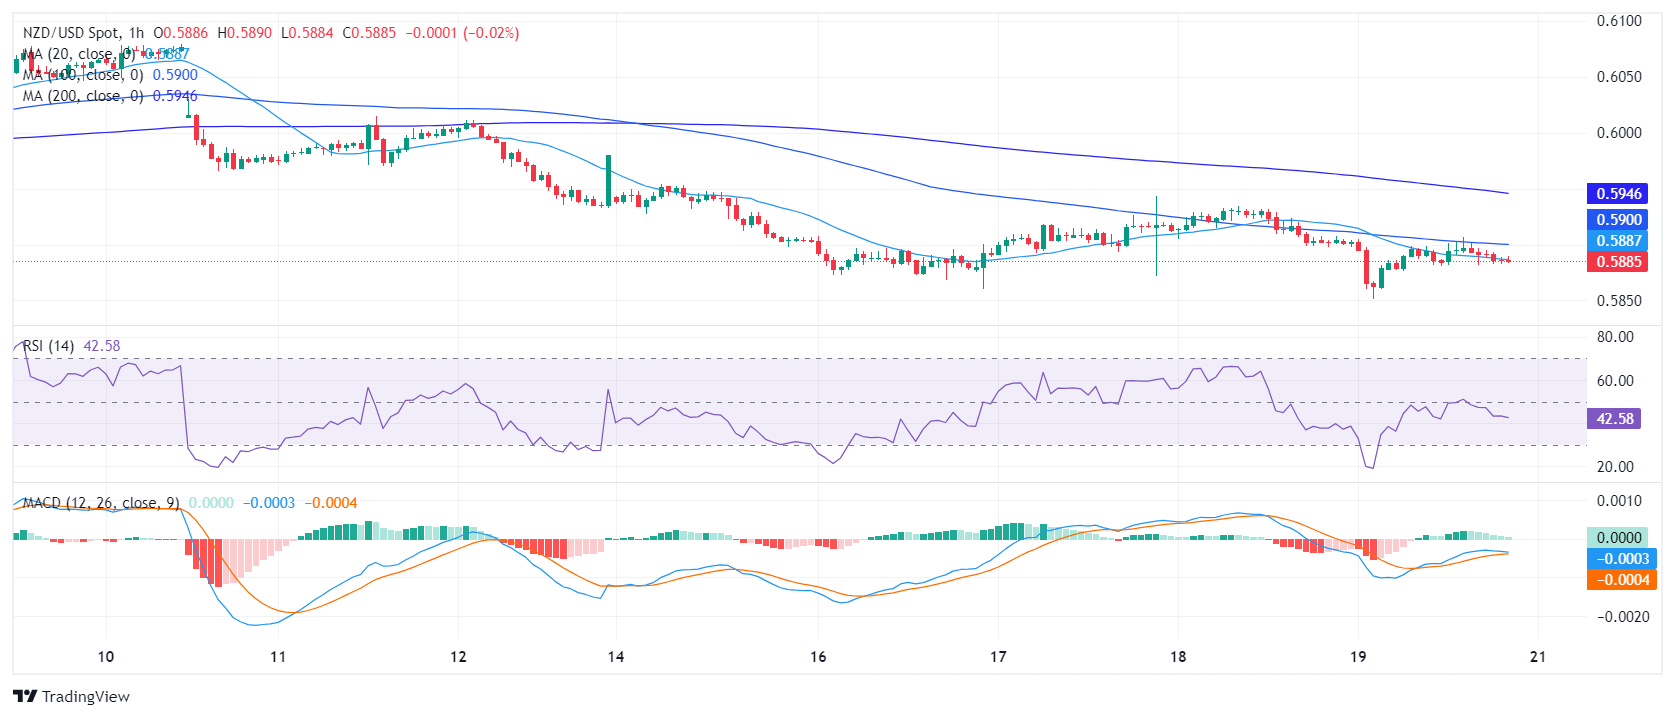
On the hourly chart, the RSI also points south standing below 50 while the MACD exhibits dwindling green bars, indicative of reduced buying momentum.
NZD/USD hourly chart
From a wider viewpoint, NZD/USD presently exhibits a clear bearish trend, given its position below the Simple Moving Average (SMA) for 20, 100, and 200-day periods. However, as indicators approach oversold conditions, the pair may stage a corrective rebound which could give the buyers a chance to reclaim the 20-day SMA. In the meantime, movements below these levels would leave the trend bearish.


© 2000-2026. Bản quyền Teletrade.
Trang web này được quản lý bởi Teletrade D.J. LLC 2351 LLC 2022 (Euro House, Richmond Hill Road, Kingstown, VC0100, St. Vincent and the Grenadines).
Thông tin trên trang web không phải là cơ sở để đưa ra quyết định đầu tư và chỉ được cung cấp cho mục đích làm quen.
Giao dịch trên thị trường tài chính (đặc biệt là giao dịch sử dụng các công cụ biên) mở ra những cơ hội lớn và tạo điều kiện cho các nhà đầu tư sẵn sàng mạo hiểm để thu lợi nhuận, tuy nhiên nó mang trong mình nguy cơ rủi ro khá cao. Chính vì vậy trước khi tiến hành giao dịch cần phải xem xét mọi mặt vấn đề chấp nhận tiến hành giao dịch cụ thể xét theo quan điểm của nguồn lực tài chính sẵn có và mức độ am hiểu thị trường tài chính.
Sử dụng thông tin: sử dụng toàn bộ hay riêng biệt các dữ liệu trên trang web của công ty TeleTrade như một nguồn cung cấp thông tin nhất định. Việc sử dụng tư liệu từ trang web cần kèm theo liên kết đến trang teletrade.vn. Việc tự động thu thập số liệu cũng như thông tin từ trang web TeleTrade đều không được phép.
Xin vui lòng liên hệ với pr@teletrade.global nếu có câu hỏi.
ngân hàng