- Phân tích
- Tin tức và các công cụ
- Tin tức thị trường
- EUR/JPY Price Analysis: Bullish momentum prevails, reaches its highest since 2008
EUR/JPY Price Analysis: Bullish momentum prevails, reaches its highest since 2008
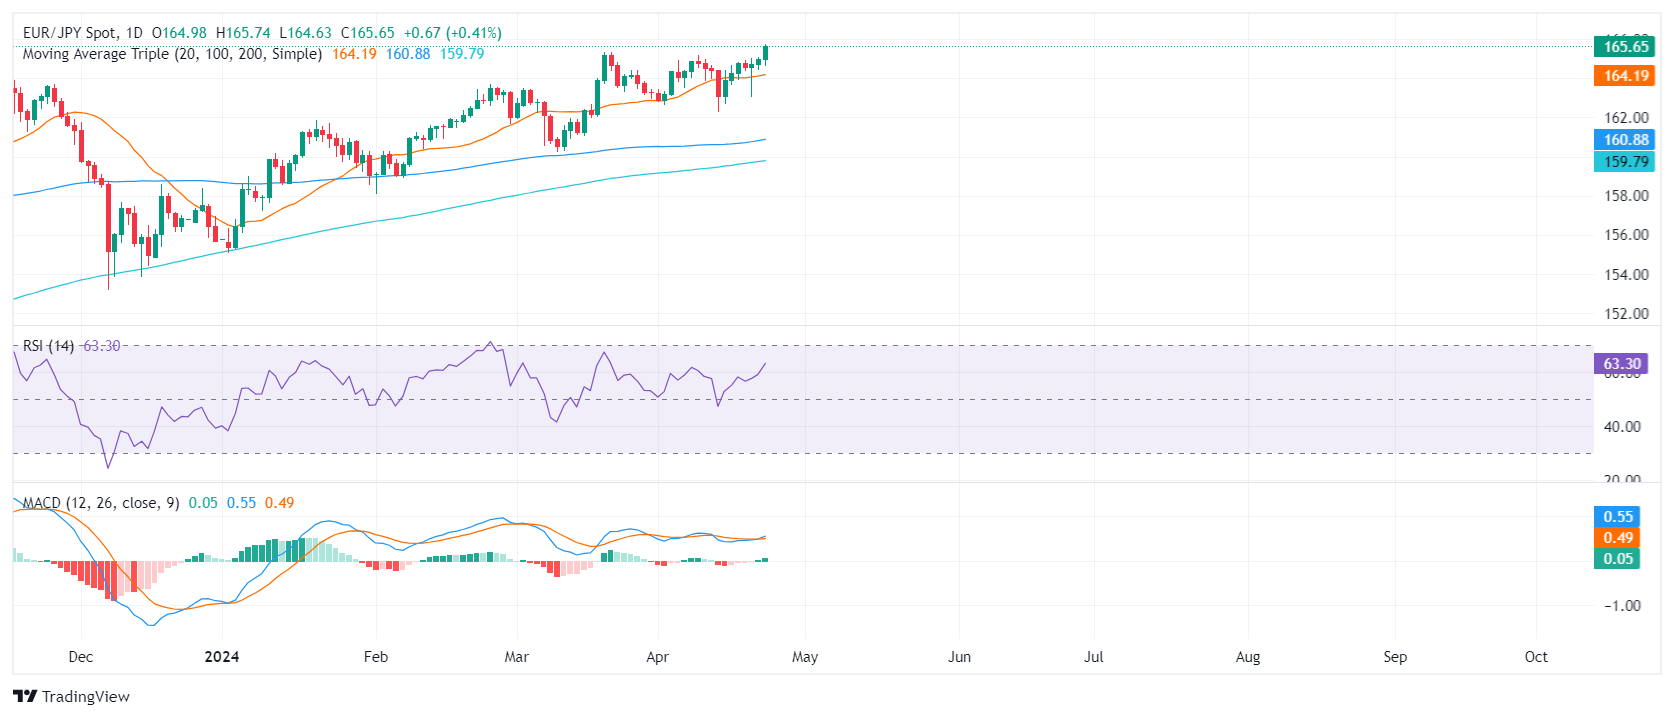
- The daily RSI signals growing buying momentum for the EUR/JPY.
- The daily MACD also shows a strengthening buying momentum.
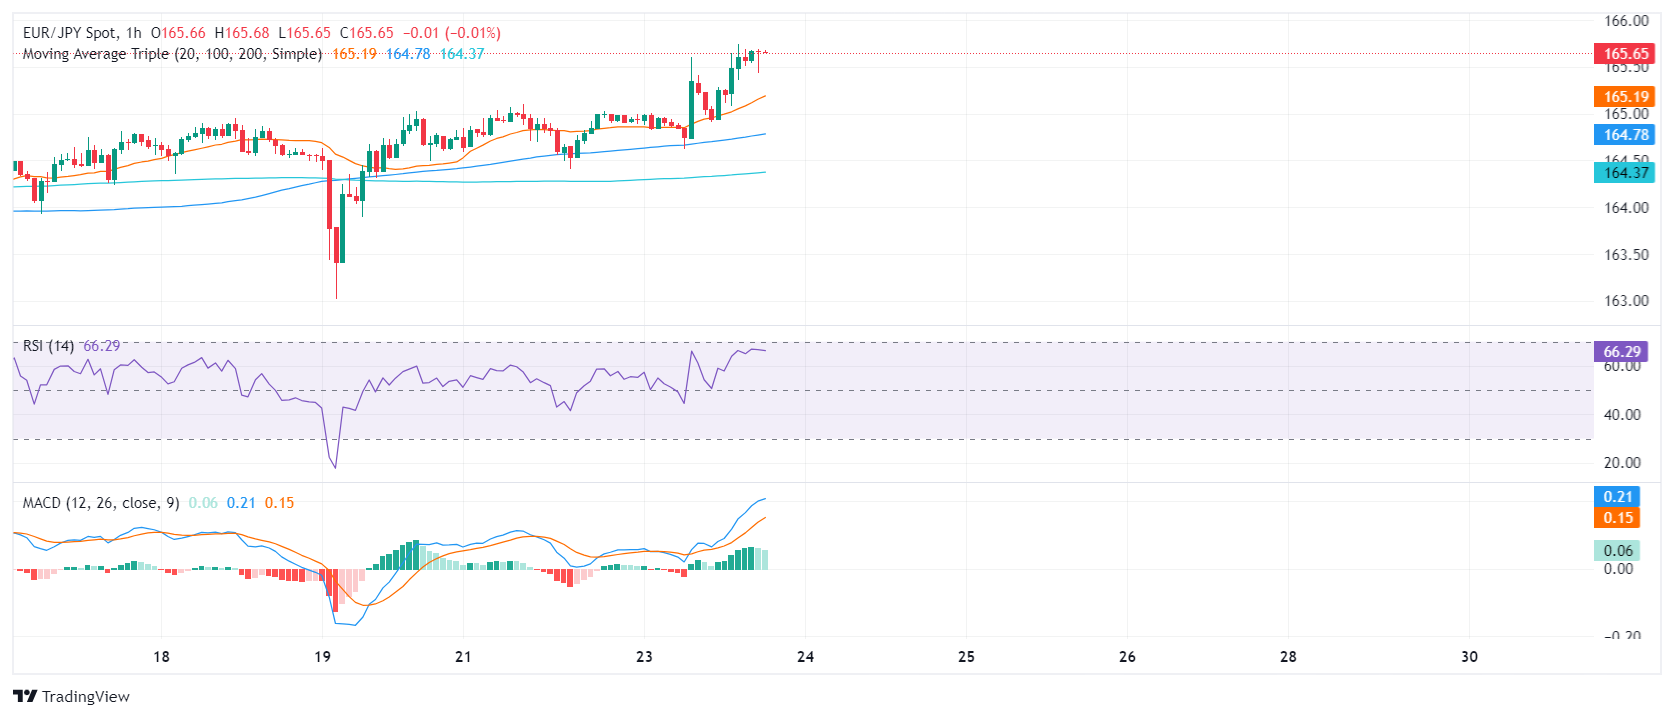
- On the hourly chart, the same indicators reveal signs of a more immediate buyer dominance.
The EUR/JPY rose towards 165.64 on Tuesday’s session, its highest level since 2008, showcasing clear bullish signals that point to further gains. With buyers in command, the overall landscape for the pair can be viewed as bullish.
On the daily chart, the Relative Strength Index (RSI) shows an ascending trend for the, moving deep in positive terrain. Concurrently, the Moving Average Convergence Divergence (MACD) backs this outlook as its histogram displays ascending green bars, underscoring the positive momentum.
EUR/JPY daily chart
In contrast, the insight from the hourly chart provides a slightly different perspective. While the RSI also showcases an uptrend into positive territory, the current level was higher than that of the daily chart, hinting at a more immediate upward momentum. Simultaneously, the MACD on the hourly chart strengthens the bullish bias, evident from the rising green bars.
EUR/JPY hourly chart
Observing the broader view, the EUR/JPY stands above its 20, 100, and 200-day Simple Moving Average (SMA), suggesting a strong bullish trend both in the short and long-term perspectives. Overall, bears show no signs of recovering and as bulls capture fresh multi-year highs, there are no technical signals that threaten the clear bullish trend.


© 2000-2026. Bản quyền Teletrade.
Trang web này được quản lý bởi Teletrade D.J. LLC 2351 LLC 2022 (Euro House, Richmond Hill Road, Kingstown, VC0100, St. Vincent and the Grenadines).
Thông tin trên trang web không phải là cơ sở để đưa ra quyết định đầu tư và chỉ được cung cấp cho mục đích làm quen.
Giao dịch trên thị trường tài chính (đặc biệt là giao dịch sử dụng các công cụ biên) mở ra những cơ hội lớn và tạo điều kiện cho các nhà đầu tư sẵn sàng mạo hiểm để thu lợi nhuận, tuy nhiên nó mang trong mình nguy cơ rủi ro khá cao. Chính vì vậy trước khi tiến hành giao dịch cần phải xem xét mọi mặt vấn đề chấp nhận tiến hành giao dịch cụ thể xét theo quan điểm của nguồn lực tài chính sẵn có và mức độ am hiểu thị trường tài chính.
Sử dụng thông tin: sử dụng toàn bộ hay riêng biệt các dữ liệu trên trang web của công ty TeleTrade như một nguồn cung cấp thông tin nhất định. Việc sử dụng tư liệu từ trang web cần kèm theo liên kết đến trang teletrade.vn. Việc tự động thu thập số liệu cũng như thông tin từ trang web TeleTrade đều không được phép.
Xin vui lòng liên hệ với pr@teletrade.global nếu có câu hỏi.
ngân hàng