- Phân tích
- Tin tức và các công cụ
- Tin tức thị trường
- NZD/JPY Price Analysis: Bullish strength persists, additional corrective pullbacks are possible
NZD/JPY Price Analysis: Bullish strength persists, additional corrective pullbacks are possible
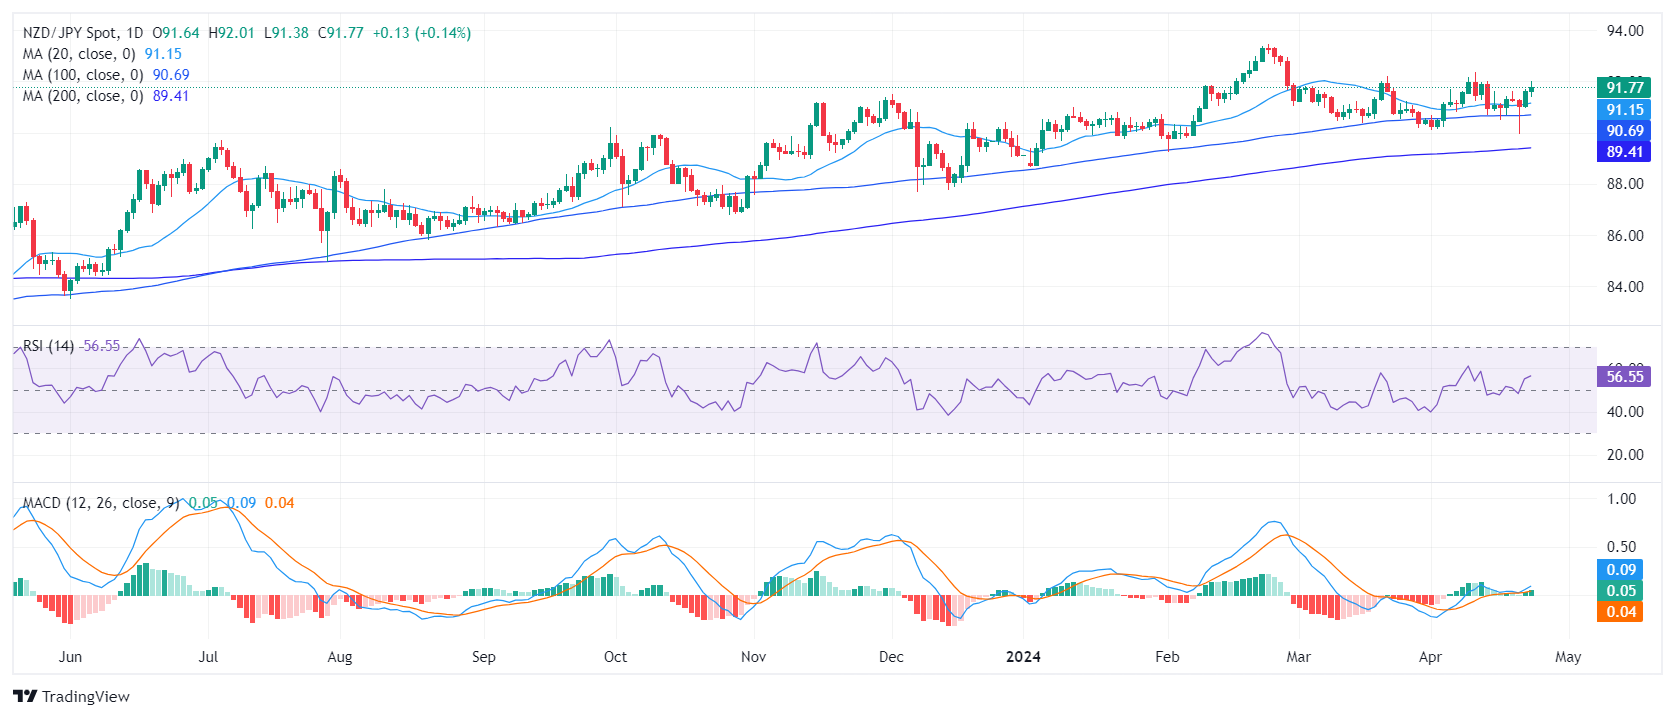
- The daily chart for NZD/JPY reveals continuing bullish momentum, with indicators in positive terrain.
- The hourly indicators are correcting overbought conditions.
The NZD/JPY tallied daily gains on Tuesday’s session and rose to 91.78. The pair maintains a solid footing above all main Simple Moving Averages (SMAs), which may signal additional strength despite intra-day pull-backs seen during the American session. Indicators remain strong on the daily chart but the hourly ones are losing traction as they are correcting overbought conditions.
On the daily chart, the Relative Strength Index (RSI) for the NZD/JPY has been trending positively within the positive territory. The Moving Average Convergence Divergence (MACD) histogram also displays increasing green bars, indicating bullish momentum.
NZD/JPY daily chart
On the hourly chart, the RSI shows a reading of 68 but points south which reveals that buyers seem to be taking a breather as they hit overbought conditions earlier in the session. The hourly MACD, similar to the daily chart, also prints green bars, suggesting an ongoing upward trajectory.
NZD/JPY hourly chart
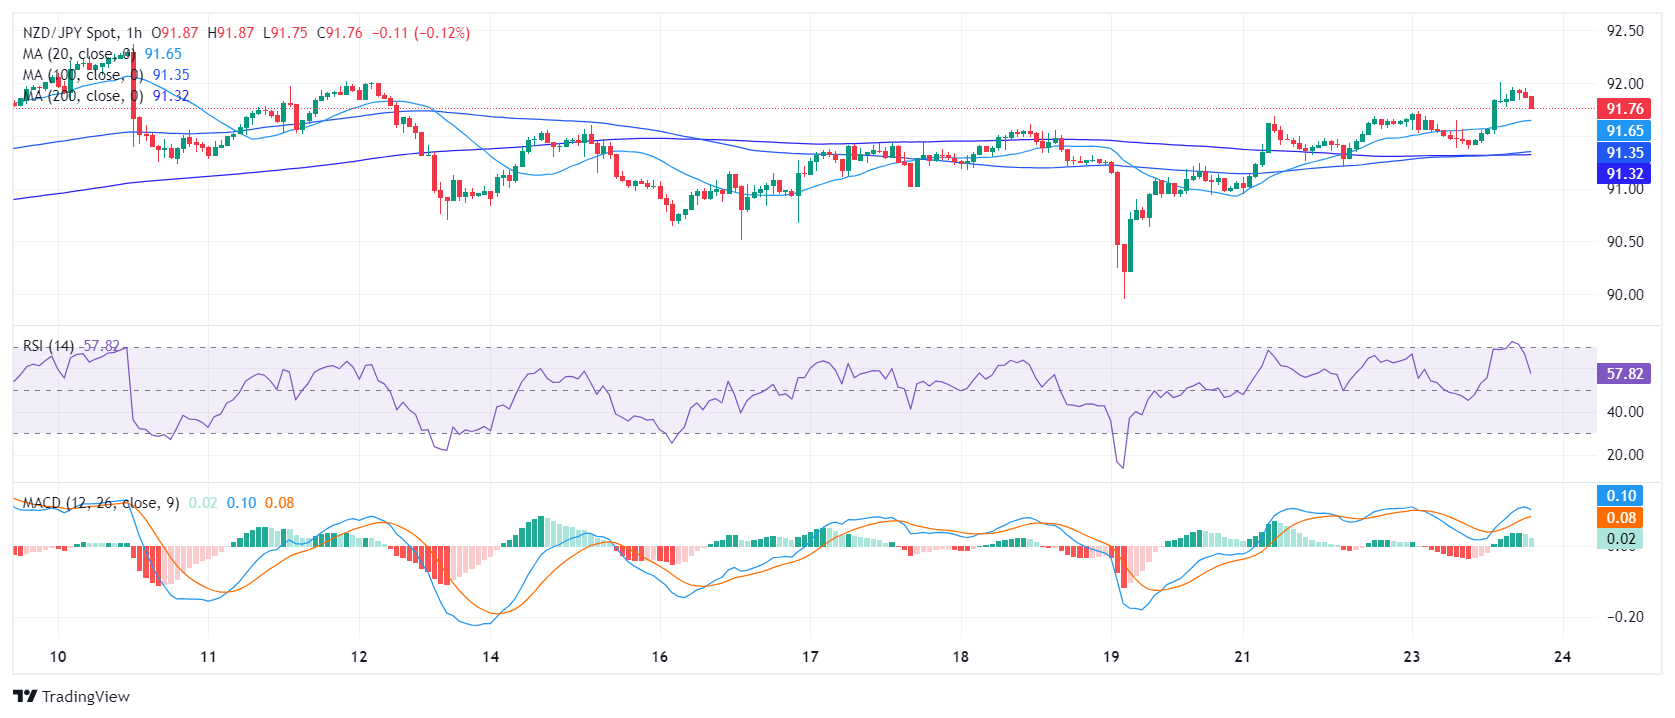
Looking at the bigger picture, the NZD/JPY remains favourably positioned above its relevant Simple Moving Average (SMA) metrics, these being the 20, 100, and 200-day time horizons. However, ahead of the Asian session the pair may see further pullbacks as indicators start to lose traction on the hourly chart. One the other hand, the daily RSI and MACD remain strong and unless the bears conquer the 20-day SMA, the outlook will remain positive.


© 2000-2026. Bản quyền Teletrade.
Trang web này được quản lý bởi Teletrade D.J. LLC 2351 LLC 2022 (Euro House, Richmond Hill Road, Kingstown, VC0100, St. Vincent and the Grenadines).
Thông tin trên trang web không phải là cơ sở để đưa ra quyết định đầu tư và chỉ được cung cấp cho mục đích làm quen.
Giao dịch trên thị trường tài chính (đặc biệt là giao dịch sử dụng các công cụ biên) mở ra những cơ hội lớn và tạo điều kiện cho các nhà đầu tư sẵn sàng mạo hiểm để thu lợi nhuận, tuy nhiên nó mang trong mình nguy cơ rủi ro khá cao. Chính vì vậy trước khi tiến hành giao dịch cần phải xem xét mọi mặt vấn đề chấp nhận tiến hành giao dịch cụ thể xét theo quan điểm của nguồn lực tài chính sẵn có và mức độ am hiểu thị trường tài chính.
Sử dụng thông tin: sử dụng toàn bộ hay riêng biệt các dữ liệu trên trang web của công ty TeleTrade như một nguồn cung cấp thông tin nhất định. Việc sử dụng tư liệu từ trang web cần kèm theo liên kết đến trang teletrade.vn. Việc tự động thu thập số liệu cũng như thông tin từ trang web TeleTrade đều không được phép.
Xin vui lòng liên hệ với pr@teletrade.global nếu có câu hỏi.
ngân hàng