- Phân tích
- Tin tức và các công cụ
- Tin tức thị trường
- NZD/USD Price Analysis: Slight bullish momentum noted, long-term bearish bias intact
NZD/USD Price Analysis: Slight bullish momentum noted, long-term bearish bias intact
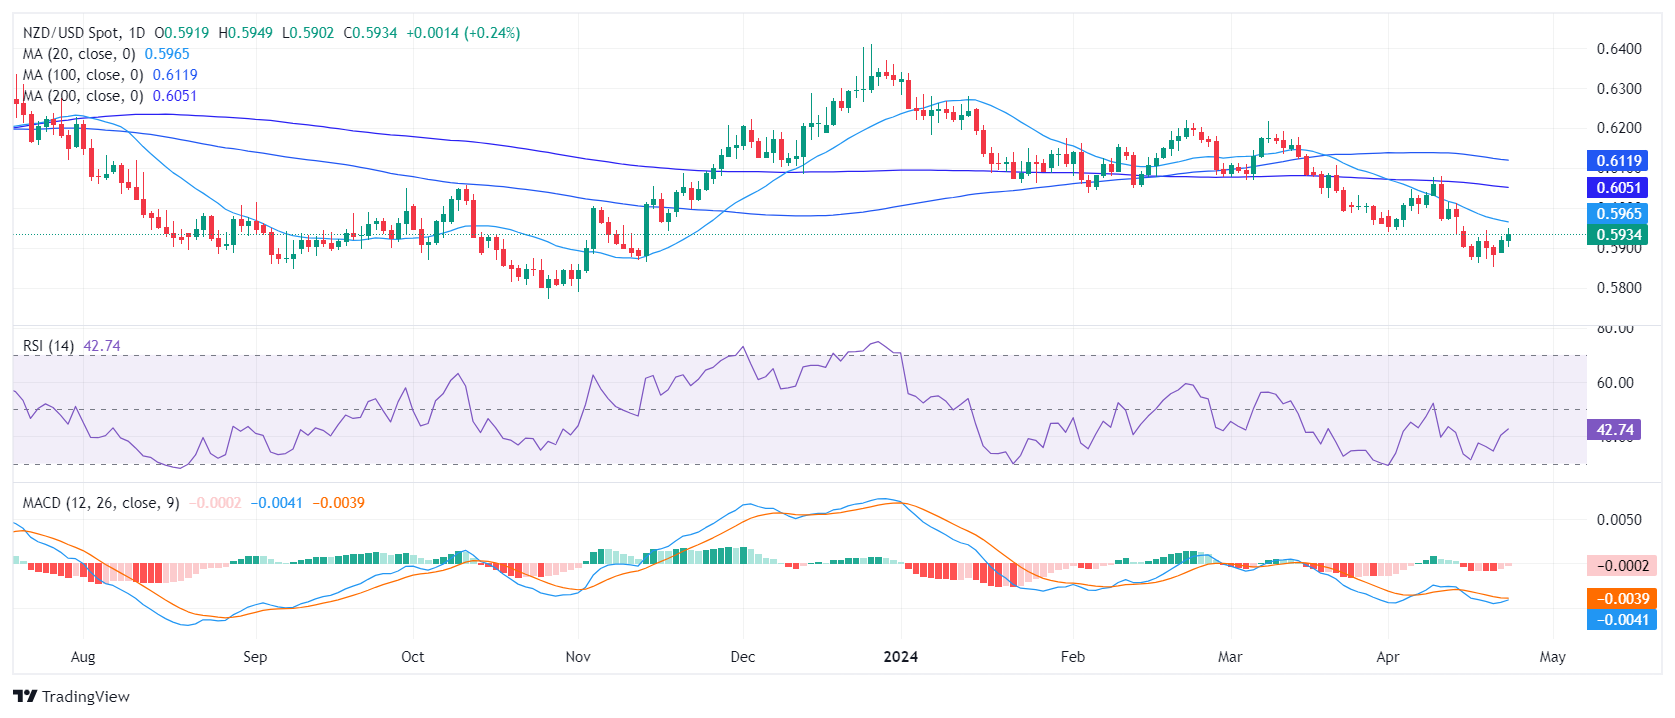
- The RSI of the NZD/USD on the daily chart shows a slight recovery from the buyers.
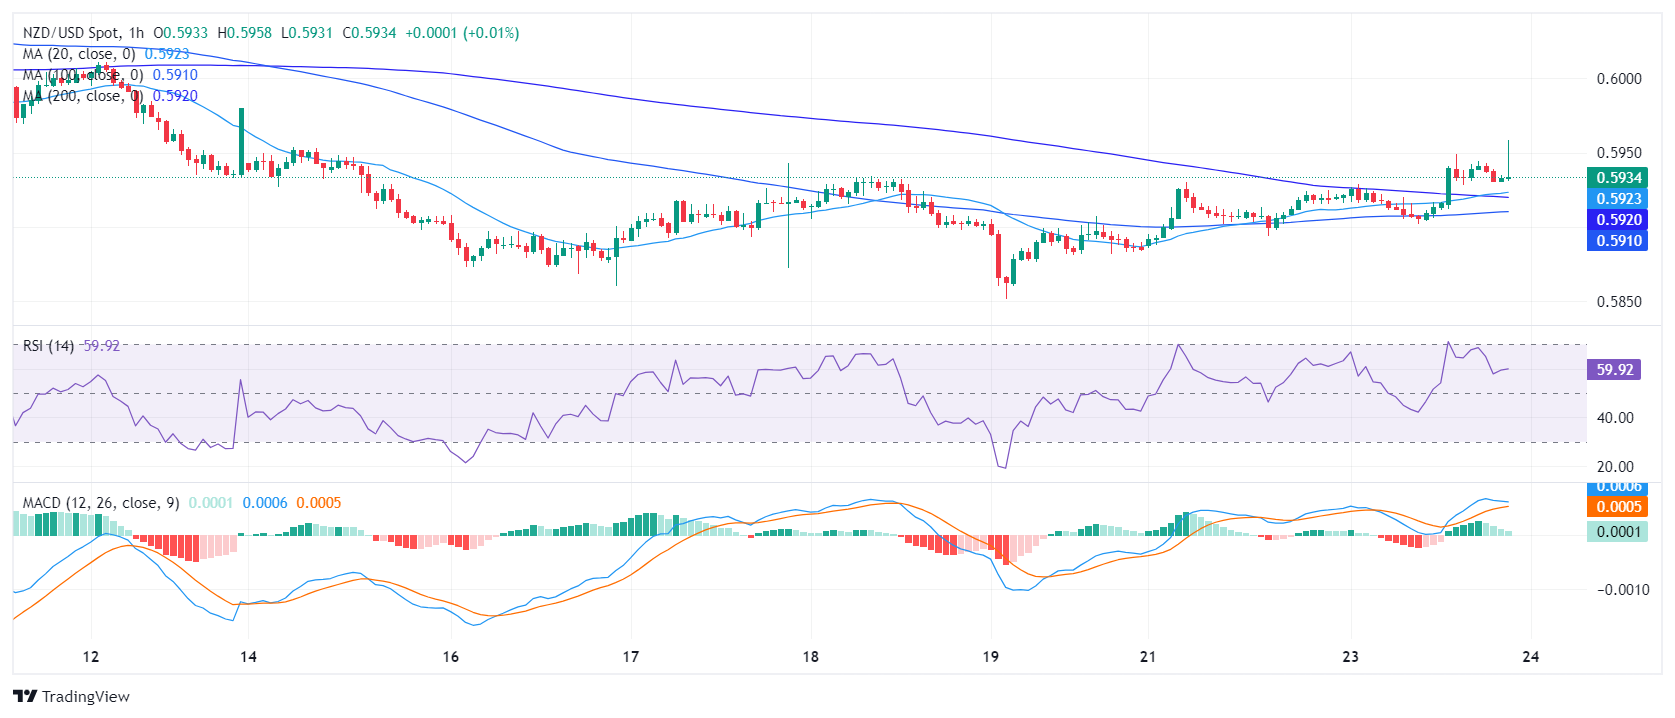
- The hourly chart presents a more positive picture, with RSI remaining above 50, signaling increasing buying momentum.
The NZD/USD trades rose to 0.5930 in Tuesday’s session, marking a slight increase with gains of 0.17%. The currency pair continues to be guided by a long-term bearish trend. However, there is an attempt to challenge this bearish supremacy by buyers, albeit modest, and hourly indicators suggest that the momentum picked up is still weak.
On the daily chart, the Relative Strength Index (RSI) reveals a slight recovery showing a reading of 43, still within the negative territory, but suggesting a recent shift in bias among traders from negative to possibly a more positive trend. The decreasing red bars of the Moving Average Convergence Divergence (MACD) also support a weakening of the selling traction and a possible shift.
NZD/USD daily chart
The hourly Relative Strength Index (RSI) presents a more upbeat picture, remaining above the 50 level, with a recent peak close to the 70 level. The latest reading stands at 57.75, providing a boost in momentum. Concurrently, the hourly Moving Average Convergence Divergence (MACD) registers decreasing green bars, indicating weak buying traction.
NZD/USD hourly chart
In terms of the broader outlook, the NZD/USD resides in a definitive bearish stance as its latest position stays below the key Simple Moving Averages (SMA), of 20, 100, and 200-days SMA. This positioning suggests that the overall trend leans heavily towards the downside. In addition, positive signals were detected on the hourly and daily chart but those signals were not decisive buying signals as the buying momentum remains weak. Buyers must increase their efforts and reclaim the 20-day SMA to start talking.


© 2000-2026. Bản quyền Teletrade.
Trang web này được quản lý bởi Teletrade D.J. LLC 2351 LLC 2022 (Euro House, Richmond Hill Road, Kingstown, VC0100, St. Vincent and the Grenadines).
Thông tin trên trang web không phải là cơ sở để đưa ra quyết định đầu tư và chỉ được cung cấp cho mục đích làm quen.
Giao dịch trên thị trường tài chính (đặc biệt là giao dịch sử dụng các công cụ biên) mở ra những cơ hội lớn và tạo điều kiện cho các nhà đầu tư sẵn sàng mạo hiểm để thu lợi nhuận, tuy nhiên nó mang trong mình nguy cơ rủi ro khá cao. Chính vì vậy trước khi tiến hành giao dịch cần phải xem xét mọi mặt vấn đề chấp nhận tiến hành giao dịch cụ thể xét theo quan điểm của nguồn lực tài chính sẵn có và mức độ am hiểu thị trường tài chính.
Sử dụng thông tin: sử dụng toàn bộ hay riêng biệt các dữ liệu trên trang web của công ty TeleTrade như một nguồn cung cấp thông tin nhất định. Việc sử dụng tư liệu từ trang web cần kèm theo liên kết đến trang teletrade.vn. Việc tự động thu thập số liệu cũng như thông tin từ trang web TeleTrade đều không được phép.
Xin vui lòng liên hệ với pr@teletrade.global nếu có câu hỏi.
ngân hàng