- Phân tích
- Tin tức và các công cụ
- Tin tức thị trường
- GBP/USD Price Analysis: Rises to near 1.2450 despite the bearish sentiment
GBP/USD Price Analysis: Rises to near 1.2450 despite the bearish sentiment
- GBP/USD tests the major level of 1.2450 despite the bearish sentiment shown by the technical analysis.
- The pair continues to trade below the pullback resistance level at 1.2518, positioned near the lower boundary of the descending triangle.
- The breach into the descending channel around the level of 1.2490 may lead to a weakening of the bearish sentiment.
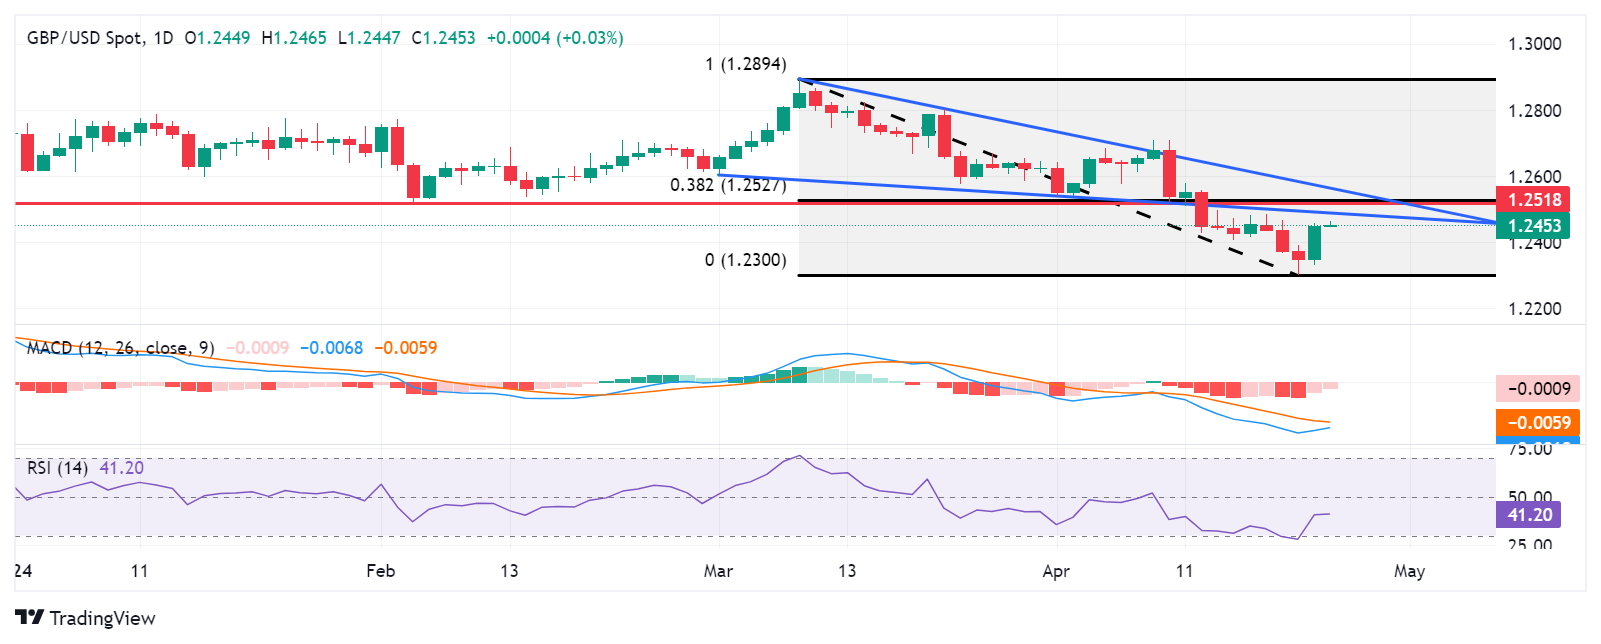
GBP/USD has been on the rise for the second consecutive day, trading around 1.2450 in Asian trading on Wednesday. However, the pair is still below the pullback resistance at 1.2518, which coincides with the lower boundary of the descending triangle at 1.2510. Furthermore, the 14-day Relative Strength Index (RSI) is below the 50 level, indicating a bearish sentiment.
Additionally, the Moving Average Convergence Divergence (MACD) confirms this bearish trend, with the MACD line below the centerline and the signal line. Looking ahead, GBP/USD could encounter significant support around the psychological level of 1.2400. If this level is breached, the pair may test the five-month low of 1.2300.
On the upside, breaching the descending triangle around the level of 1.2490, along with surpassing the psychological level of 1.2500, could potentially weaken the bearish sentiment. Further resistance is anticipated around the pullback resistance level at 1.2518 and the 38.2% Fibonacci retracement level at 1.2527, drawn between 1.2894 and 1.2300.
A breakthrough above the latter resistance region might signify a shift towards a bullish sentiment. In such a scenario, GBP/USD could aim to test the upper boundary of the descending triangle around 1.2565.
GBP/USD: Daily Chart


© 2000-2026. Bản quyền Teletrade.
Trang web này được quản lý bởi Teletrade D.J. LLC 2351 LLC 2022 (Euro House, Richmond Hill Road, Kingstown, VC0100, St. Vincent and the Grenadines).
Thông tin trên trang web không phải là cơ sở để đưa ra quyết định đầu tư và chỉ được cung cấp cho mục đích làm quen.
Giao dịch trên thị trường tài chính (đặc biệt là giao dịch sử dụng các công cụ biên) mở ra những cơ hội lớn và tạo điều kiện cho các nhà đầu tư sẵn sàng mạo hiểm để thu lợi nhuận, tuy nhiên nó mang trong mình nguy cơ rủi ro khá cao. Chính vì vậy trước khi tiến hành giao dịch cần phải xem xét mọi mặt vấn đề chấp nhận tiến hành giao dịch cụ thể xét theo quan điểm của nguồn lực tài chính sẵn có và mức độ am hiểu thị trường tài chính.
Sử dụng thông tin: sử dụng toàn bộ hay riêng biệt các dữ liệu trên trang web của công ty TeleTrade như một nguồn cung cấp thông tin nhất định. Việc sử dụng tư liệu từ trang web cần kèm theo liên kết đến trang teletrade.vn. Việc tự động thu thập số liệu cũng như thông tin từ trang web TeleTrade đều không được phép.
Xin vui lòng liên hệ với pr@teletrade.global nếu có câu hỏi.
ngân hàng