- Phân tích
- Tin tức và các công cụ
- Tin tức thị trường
- NZD/USD Price Analysis: Could break into the symmetrical triangle, rises to near 0.5950
NZD/USD Price Analysis: Could break into the symmetrical triangle, rises to near 0.5950
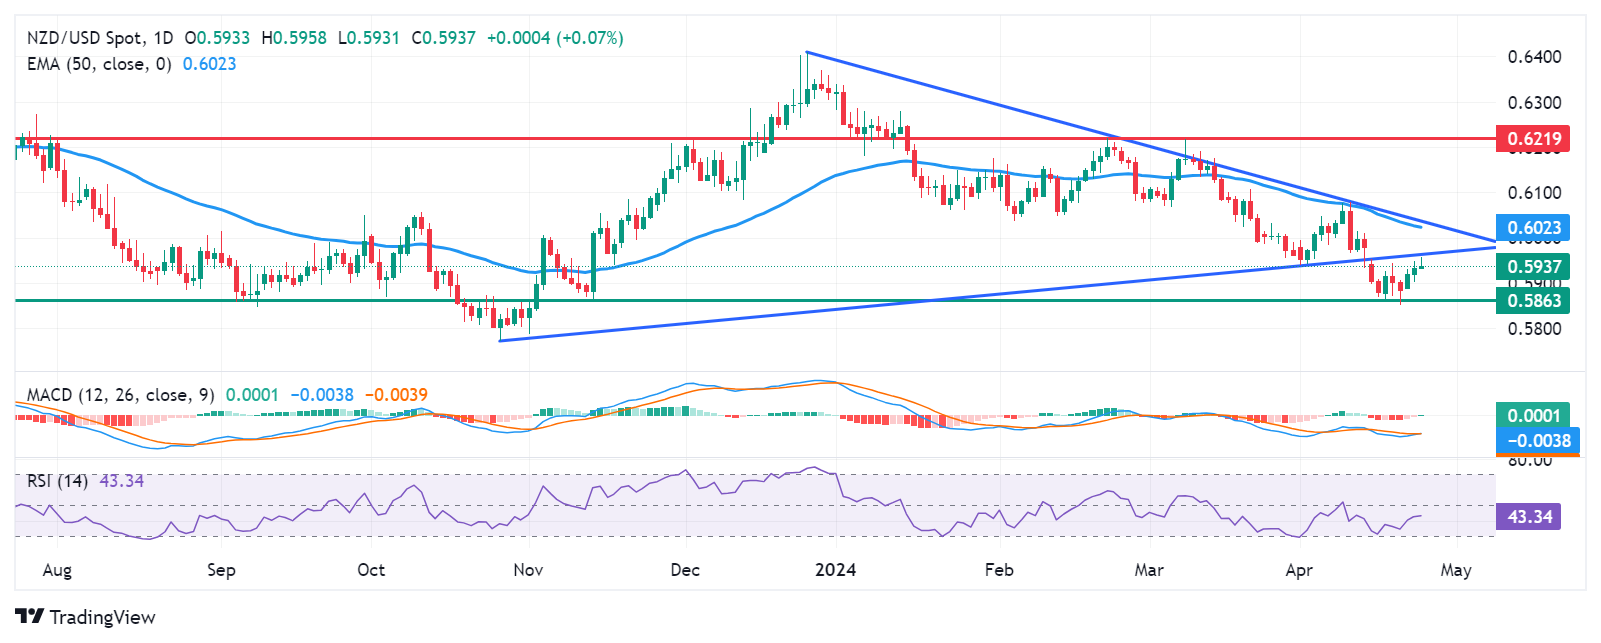
- NZD/USD extends gains despite the prevailing bearish sentiment for the pair.
- A break below 0.5900 could lead the pair to test the rebound support level of 0.5863.
- A break into the triangle around the level of 0.5963 has the potential to weaken the bearish sentiment.
NZD/USD advances for the third consecutive session on Wednesday, trading around 0.5940 during the European session. The pair is testing the lower boundary of the daily symmetrical triangle around the level of 0.5963. A breach into the triangle could potentially weaken the bearish sentiment.
However, analysis of the lagging indicator Moving Average Convergence Divergence (MACD) suggests a downward trend for the NZD/USD pair. This is indicated by the placement of the MACD line below the centerline and the signal line.
Additionally, the 14-day Relative Strength Index (RSI) remains below the 50 level, further confirming the bearish sentiment. This could prompt NZD/USD to approach the psychological level of 0.5900. A break below this level may lead the pair to test the rebound support region around the levels of 0.5863 and 0.5850.
Alternatively, If the NZD/USD pair breaks into the symmetrical triangle, it might target the psychological barrier of 0.6000. A breakthrough above this level could support the pair's momentum to test the 50-day Exponential Moving Average (EMA) at 0.6023, which aligns with the upper boundary of the triangle around 0.6030.
NZD/USD: Daily Chart


© 2000-2026. Bản quyền Teletrade.
Trang web này được quản lý bởi Teletrade D.J. LLC 2351 LLC 2022 (Euro House, Richmond Hill Road, Kingstown, VC0100, St. Vincent and the Grenadines).
Thông tin trên trang web không phải là cơ sở để đưa ra quyết định đầu tư và chỉ được cung cấp cho mục đích làm quen.
Giao dịch trên thị trường tài chính (đặc biệt là giao dịch sử dụng các công cụ biên) mở ra những cơ hội lớn và tạo điều kiện cho các nhà đầu tư sẵn sàng mạo hiểm để thu lợi nhuận, tuy nhiên nó mang trong mình nguy cơ rủi ro khá cao. Chính vì vậy trước khi tiến hành giao dịch cần phải xem xét mọi mặt vấn đề chấp nhận tiến hành giao dịch cụ thể xét theo quan điểm của nguồn lực tài chính sẵn có và mức độ am hiểu thị trường tài chính.
Sử dụng thông tin: sử dụng toàn bộ hay riêng biệt các dữ liệu trên trang web của công ty TeleTrade như một nguồn cung cấp thông tin nhất định. Việc sử dụng tư liệu từ trang web cần kèm theo liên kết đến trang teletrade.vn. Việc tự động thu thập số liệu cũng như thông tin từ trang web TeleTrade đều không được phép.
Xin vui lòng liên hệ với pr@teletrade.global nếu có câu hỏi.
ngân hàng