- Phân tích
- Tin tức và các công cụ
- Tin tức thị trường
- AUD/JPY Price Analysis: Bulls steer the market towards 101.00, its highest since 2014
AUD/JPY Price Analysis: Bulls steer the market towards 101.00, its highest since 2014
- The daily RSI of the AUD/JPY continues its uphill journey, nearing overbought territory, amplifying buying traction.
- Hourly indicators are also strong, with no signs of bears.
- A healthy correction shouldn't be ruled out.
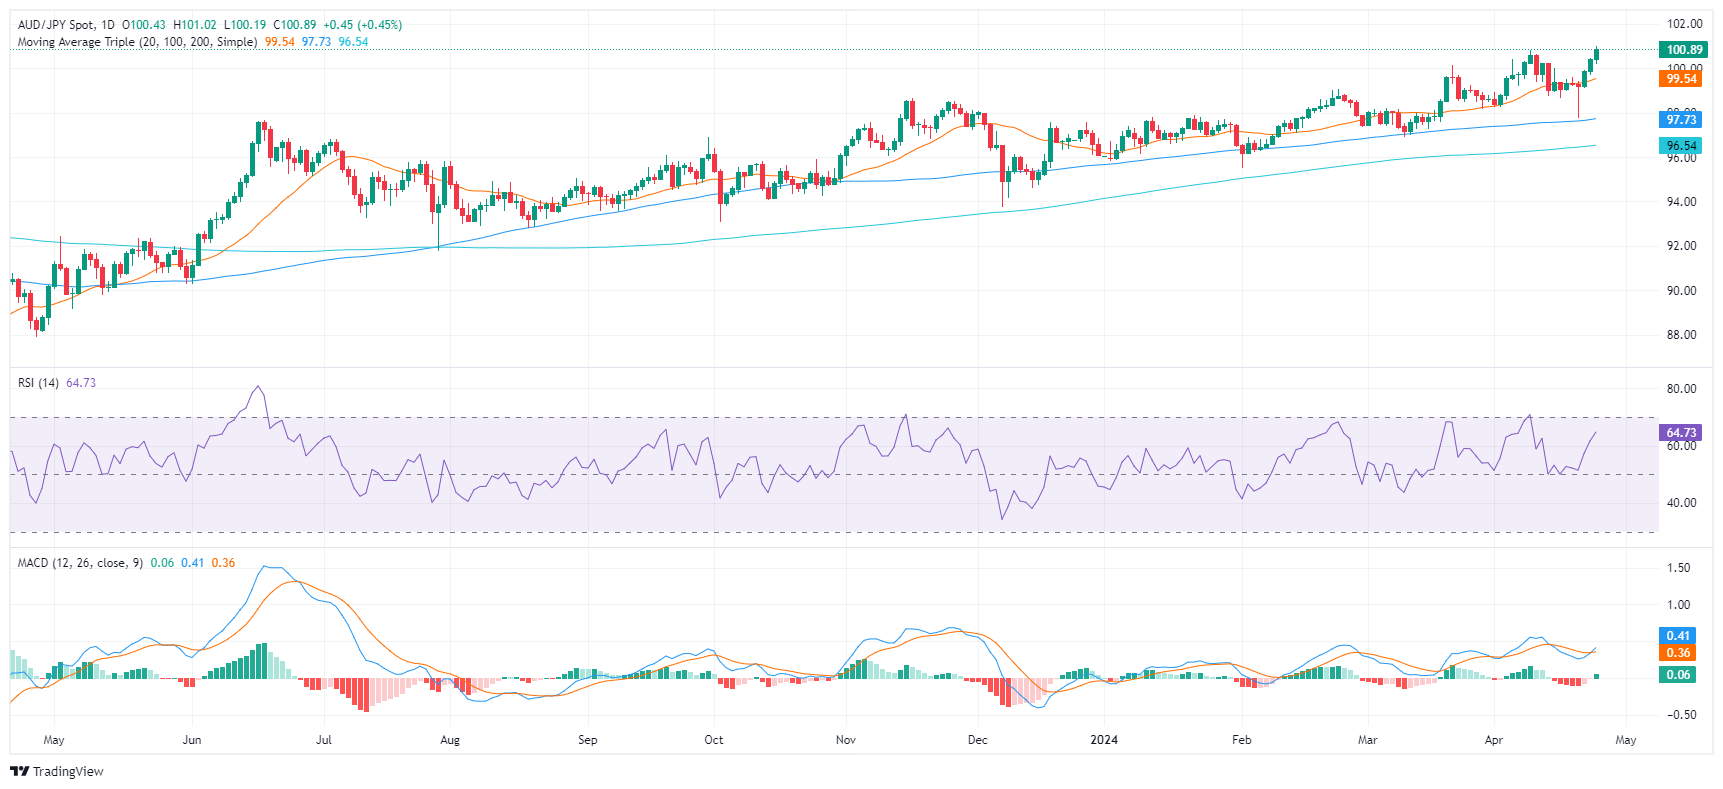
The AUD/JPY market showcases an increasingly bullish trend. The cross stabilized at 100.89 on Wednesday, after rallying to a high at 101.12, its highest since 2014. The general market interest leans towards the buyers as the pair follows an upward trend and surpasses significant levels. However, as the pair gained nearly 1.50% in the last sessions, the cross might be poised for a correction.
On the daily chart, the Relative Strength Index (RSI) of the AUD/JPY pair continues its upward trajectory nearing overbought territory. The Moving Average Convergence Divergence (MACD) also supports the buyers, as it prints a fresh green bar.
AUD/JPY daily chart
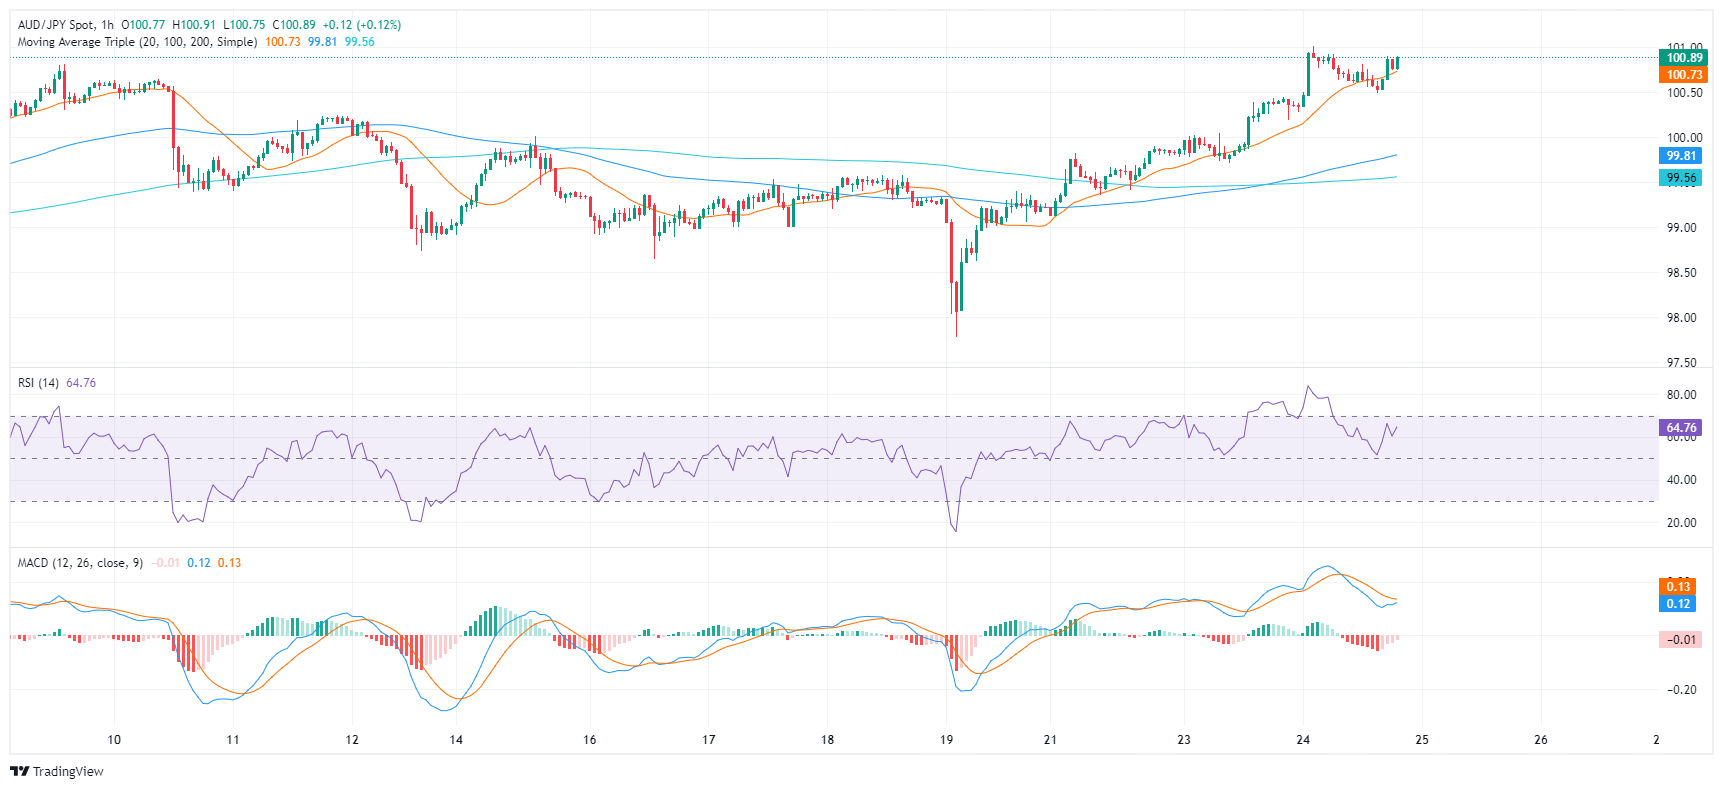
Switching the focus to the hourly chart, the hourly Relative Strength Index (RSI) displays a generally increasing trend, pointing toward positive short-term momentum. In addition, the MACD portrays decreasing red bars, denoting the declining momentum of the sellers in the short-term trading hours.
AUD/JPY hourly chart
In the broader outlook, the AUD/JPY indicates a bullish trend, given its current position above the 20, 100, and 200-day Simple Moving Average (SMA). SMAs serve as technical indicators for analyzing price trends by smoothing out price fluctuations. The pair's stance above all three SMAs suggests a strong stance from the bull in the short and long-term perspectives. In addition, the pair rallying to multi-year highs suggests that the bulls are clearly in command, but traders shouldn't be ruled out as indicators might run out of steam.


© 2000-2026. Bản quyền Teletrade.
Trang web này được quản lý bởi Teletrade D.J. LLC 2351 LLC 2022 (Euro House, Richmond Hill Road, Kingstown, VC0100, St. Vincent and the Grenadines).
Thông tin trên trang web không phải là cơ sở để đưa ra quyết định đầu tư và chỉ được cung cấp cho mục đích làm quen.
Giao dịch trên thị trường tài chính (đặc biệt là giao dịch sử dụng các công cụ biên) mở ra những cơ hội lớn và tạo điều kiện cho các nhà đầu tư sẵn sàng mạo hiểm để thu lợi nhuận, tuy nhiên nó mang trong mình nguy cơ rủi ro khá cao. Chính vì vậy trước khi tiến hành giao dịch cần phải xem xét mọi mặt vấn đề chấp nhận tiến hành giao dịch cụ thể xét theo quan điểm của nguồn lực tài chính sẵn có và mức độ am hiểu thị trường tài chính.
Sử dụng thông tin: sử dụng toàn bộ hay riêng biệt các dữ liệu trên trang web của công ty TeleTrade như một nguồn cung cấp thông tin nhất định. Việc sử dụng tư liệu từ trang web cần kèm theo liên kết đến trang teletrade.vn. Việc tự động thu thập số liệu cũng như thông tin từ trang web TeleTrade đều không được phép.
Xin vui lòng liên hệ với pr@teletrade.global nếu có câu hỏi.
ngân hàng