- Phân tích
- Tin tức và các công cụ
- Tin tức thị trường
- EUR/JPY Price Analysis: Rallies to almost 16-year high, buyers eye 167.00
EUR/JPY Price Analysis: Rallies to almost 16-year high, buyers eye 167.00
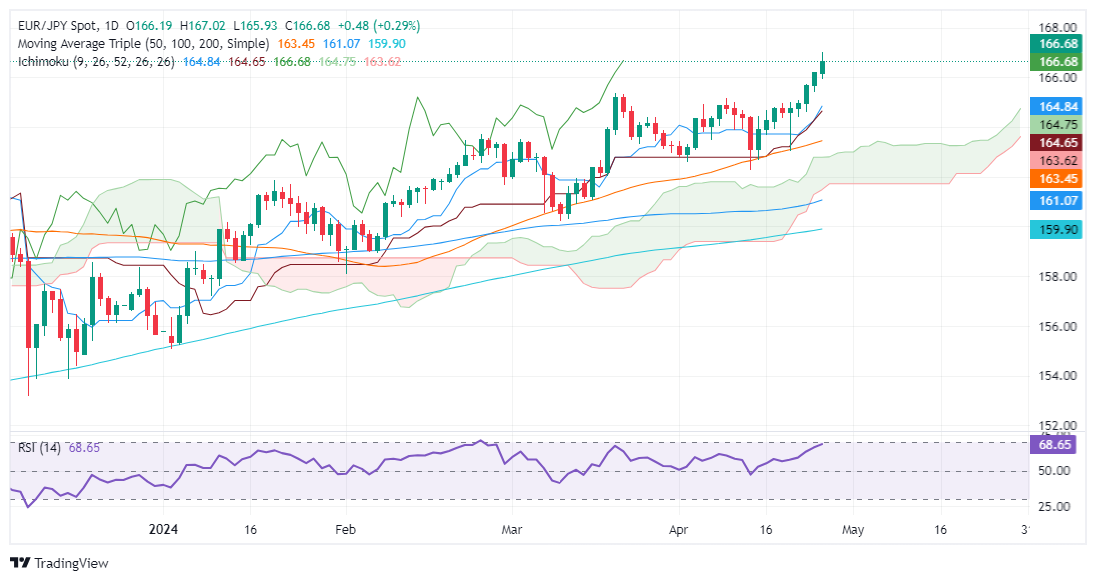
- EUR/JPY surges to levels not seen since August 2008, capitalizing on a broader Yen weakness.
- Technical indicators suggest potential for further advances after clearing resistance at 165.30, towards the 169.47 high of August 2008.
- Downside risks remain once EUR/JPY retreats below the recent high of 166.22.
The Euro rallied to a near 16-year high against the Japanese Yen, hitting levels last seen in August 2008, with the latter remaining the laggard in the FX space. Data from the United States (US) prompted investors to buy the Greenback, which sent USD/JPY to refresh multi-year highs. Therefore, the EUR/JPY followed suit and trades at 166.67, gaining more than 0.20%.
EUR/JPY Price Analysis: Technical outlook
The EUR/JPY is bullish-biased after consolidating since mid-March below the 165.30s area, previously guarded by March’s 20 high at 165.33. The uptrend resumed toward the 166.00 mark, yet once buyers cleared that hurdle, extending the move to 167.00.
Nevertheless, the EUR/JPY has retreated as buyers take a breather. The momentum its on their side, as shown by the Relative Strength Index (RSI) standing at 68.80, shy of signaling the pair is overbought.
If buyers clear 167.00, that will exacerbate a rally to challenge August’s 2008 monthly high at 169.47, ahead of the psychological 170.00 barrier.
On the other hand, if sellers drag the exchange rate below 166.22 April 24 daily high, that could open the door to sliding toward the March 20 high of 165.33. Subsequent losses beyond this support target the confluence of the Tenkan and Kijun-Sen at 164.83/64.
EUR/JPY Price Action – Daily Chart


© 2000-2026. Bản quyền Teletrade.
Trang web này được quản lý bởi Teletrade D.J. LLC 2351 LLC 2022 (Euro House, Richmond Hill Road, Kingstown, VC0100, St. Vincent and the Grenadines).
Thông tin trên trang web không phải là cơ sở để đưa ra quyết định đầu tư và chỉ được cung cấp cho mục đích làm quen.
Giao dịch trên thị trường tài chính (đặc biệt là giao dịch sử dụng các công cụ biên) mở ra những cơ hội lớn và tạo điều kiện cho các nhà đầu tư sẵn sàng mạo hiểm để thu lợi nhuận, tuy nhiên nó mang trong mình nguy cơ rủi ro khá cao. Chính vì vậy trước khi tiến hành giao dịch cần phải xem xét mọi mặt vấn đề chấp nhận tiến hành giao dịch cụ thể xét theo quan điểm của nguồn lực tài chính sẵn có và mức độ am hiểu thị trường tài chính.
Sử dụng thông tin: sử dụng toàn bộ hay riêng biệt các dữ liệu trên trang web của công ty TeleTrade như một nguồn cung cấp thông tin nhất định. Việc sử dụng tư liệu từ trang web cần kèm theo liên kết đến trang teletrade.vn. Việc tự động thu thập số liệu cũng như thông tin từ trang web TeleTrade đều không được phép.
Xin vui lòng liên hệ với pr@teletrade.global nếu có câu hỏi.
ngân hàng