- Phân tích
- Tin tức và các công cụ
- Tin tức thị trường
- NZD/JPY Price Analysis: Bulls don’t give up and continue climbing, might be time for a correction
NZD/JPY Price Analysis: Bulls don’t give up and continue climbing, might be time for a correction
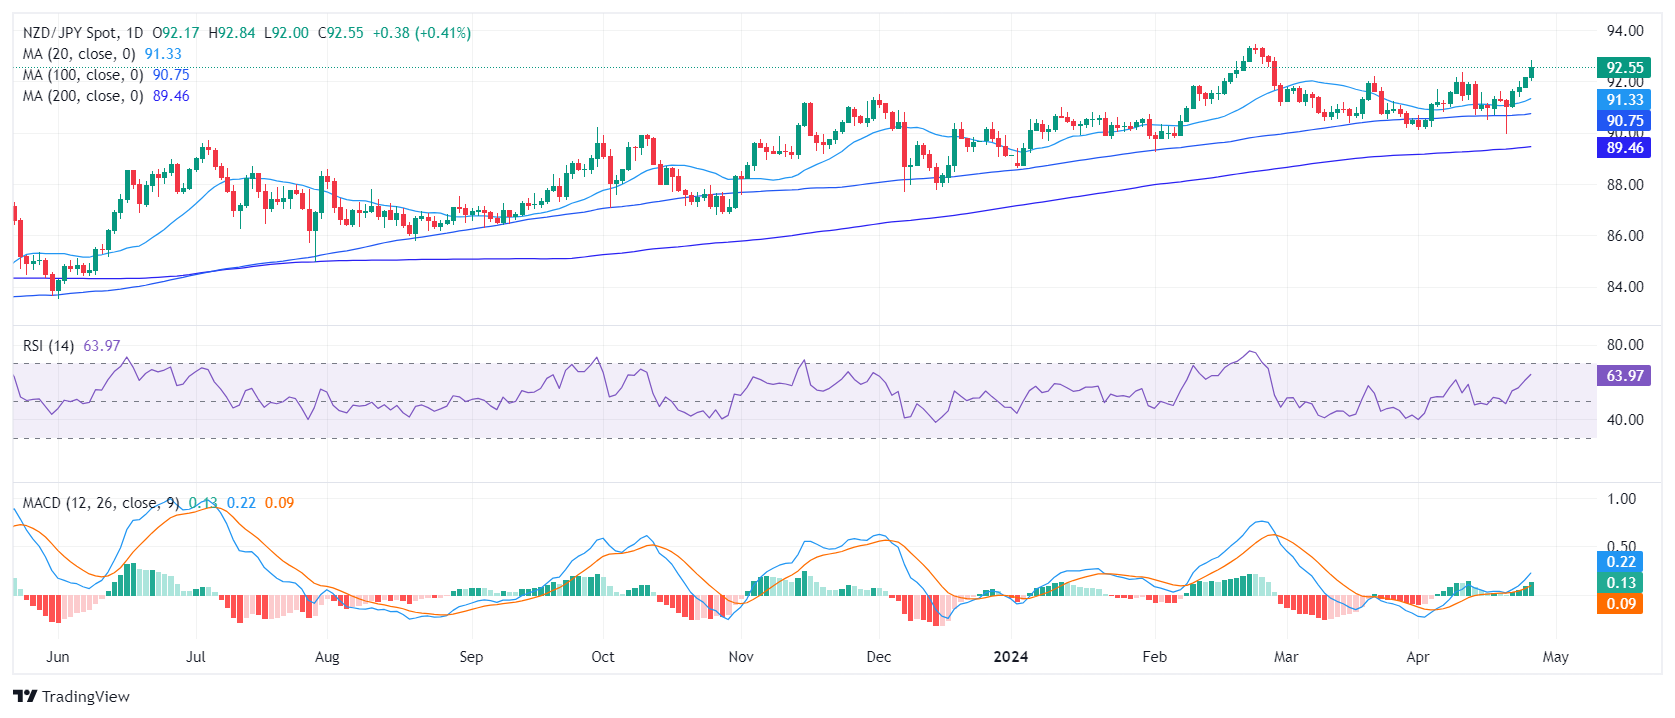
- The daily RSI shows strong buying momentum for the NZD/JPY, moving deep in positive territory.
- Parallelly, the daily MACD indicates green bars on a rising tendency, suggesting growing buying traction.
- A possible market correction may be imminent, as the daily RSI reaches near-overbought conditions.
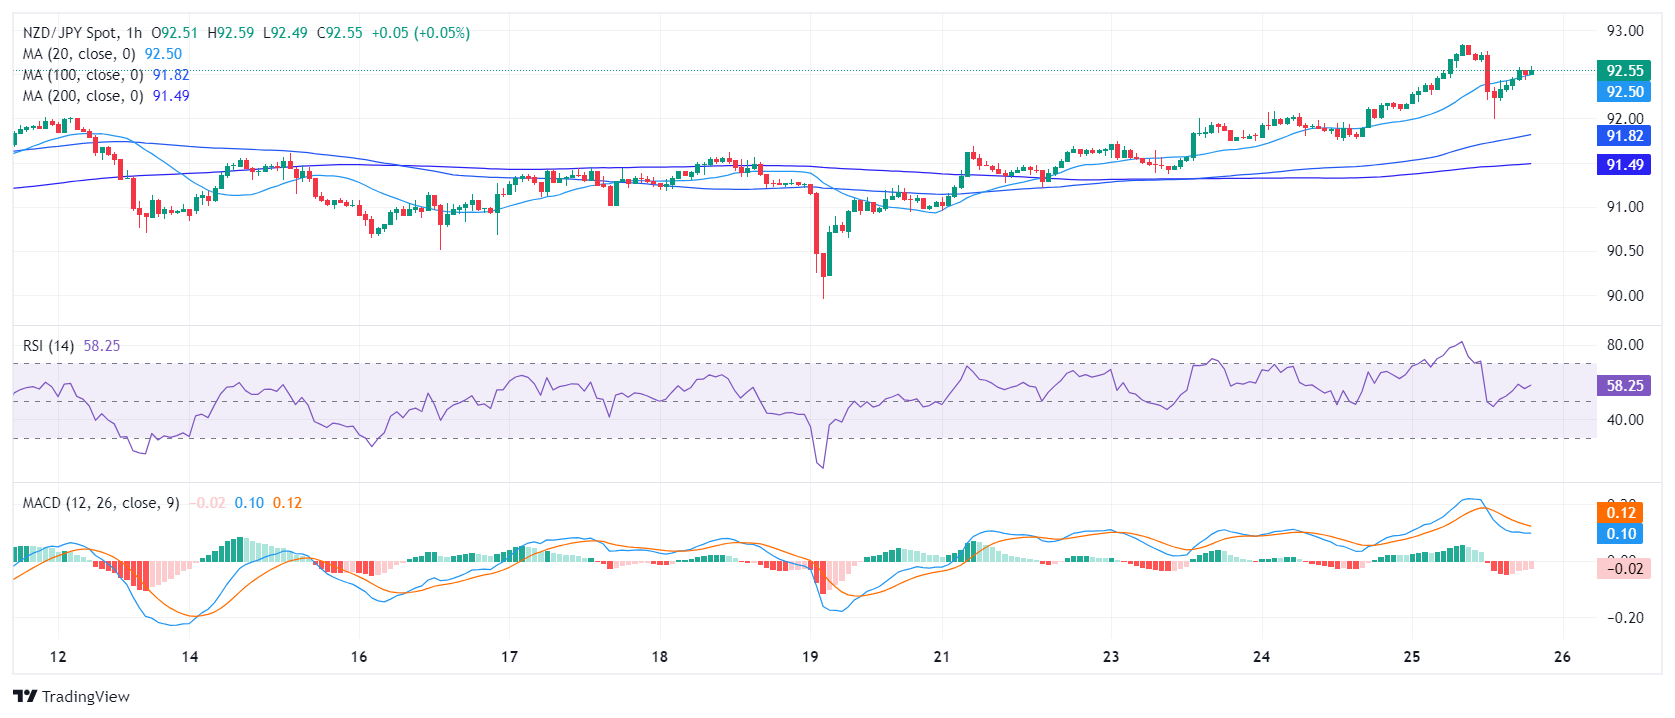
- A slight decline in the hourly indicators signals a pause in buyers' at least for Thursday’s session.
The NZD/JPY pair has shown a bullish performance, upheld by strong buying momentum over past trading sessions. Although it stands at 92.55, a high since February, signs of a potential market shift are emerging as indicators are near overbought territory.
Based on the daily chart, the Relative Strength Index (RSI) indicates increasing bullish momentum, having moved from a negative territory into positive conditions during the previous session and it resides near the 70 threshold. Concurrently, the Moving Average Convergence Divergence (MACD) shows rising green bars, indicating a developing positive momentum. Nonetheless, the RSI nearing overbought conditions provides a warning about the potential for market correction.
NZD/JPY daily chart
On the hourly chart, the RSI moved steadily upwards from a negative to a positive trend. However, recent RSI levels are slightly lower as they seem to be correcting overbought conditions noted earlier in the session.
NZD/JPY hourly chart
 In a broader context, the placement of the NZD/JPY relative to its Simple Moving Average (SMA), the cross pair is trading above its 20, 100, and 200-day SMA, suggestive of an upward trajectory. This positioning supports both short-term buy opportunities and a favorable long-term outlook, affirming a sustained long-term bullishness for the NZD/JPY.


© 2000-2026. Bản quyền Teletrade.
Trang web này được quản lý bởi Teletrade D.J. LLC 2351 LLC 2022 (Euro House, Richmond Hill Road, Kingstown, VC0100, St. Vincent and the Grenadines).
Thông tin trên trang web không phải là cơ sở để đưa ra quyết định đầu tư và chỉ được cung cấp cho mục đích làm quen.
Giao dịch trên thị trường tài chính (đặc biệt là giao dịch sử dụng các công cụ biên) mở ra những cơ hội lớn và tạo điều kiện cho các nhà đầu tư sẵn sàng mạo hiểm để thu lợi nhuận, tuy nhiên nó mang trong mình nguy cơ rủi ro khá cao. Chính vì vậy trước khi tiến hành giao dịch cần phải xem xét mọi mặt vấn đề chấp nhận tiến hành giao dịch cụ thể xét theo quan điểm của nguồn lực tài chính sẵn có và mức độ am hiểu thị trường tài chính.
Sử dụng thông tin: sử dụng toàn bộ hay riêng biệt các dữ liệu trên trang web của công ty TeleTrade như một nguồn cung cấp thông tin nhất định. Việc sử dụng tư liệu từ trang web cần kèm theo liên kết đến trang teletrade.vn. Việc tự động thu thập số liệu cũng như thông tin từ trang web TeleTrade đều không được phép.
Xin vui lòng liên hệ với pr@teletrade.global nếu có câu hỏi.
ngân hàng