- Phân tích
- Tin tức và các công cụ
- Tin tức thị trường
- Silver Price Analysis: XAG/USD dips amid strong US Dollar, warmer inflation
Silver Price Analysis: XAG/USD dips amid strong US Dollar, warmer inflation
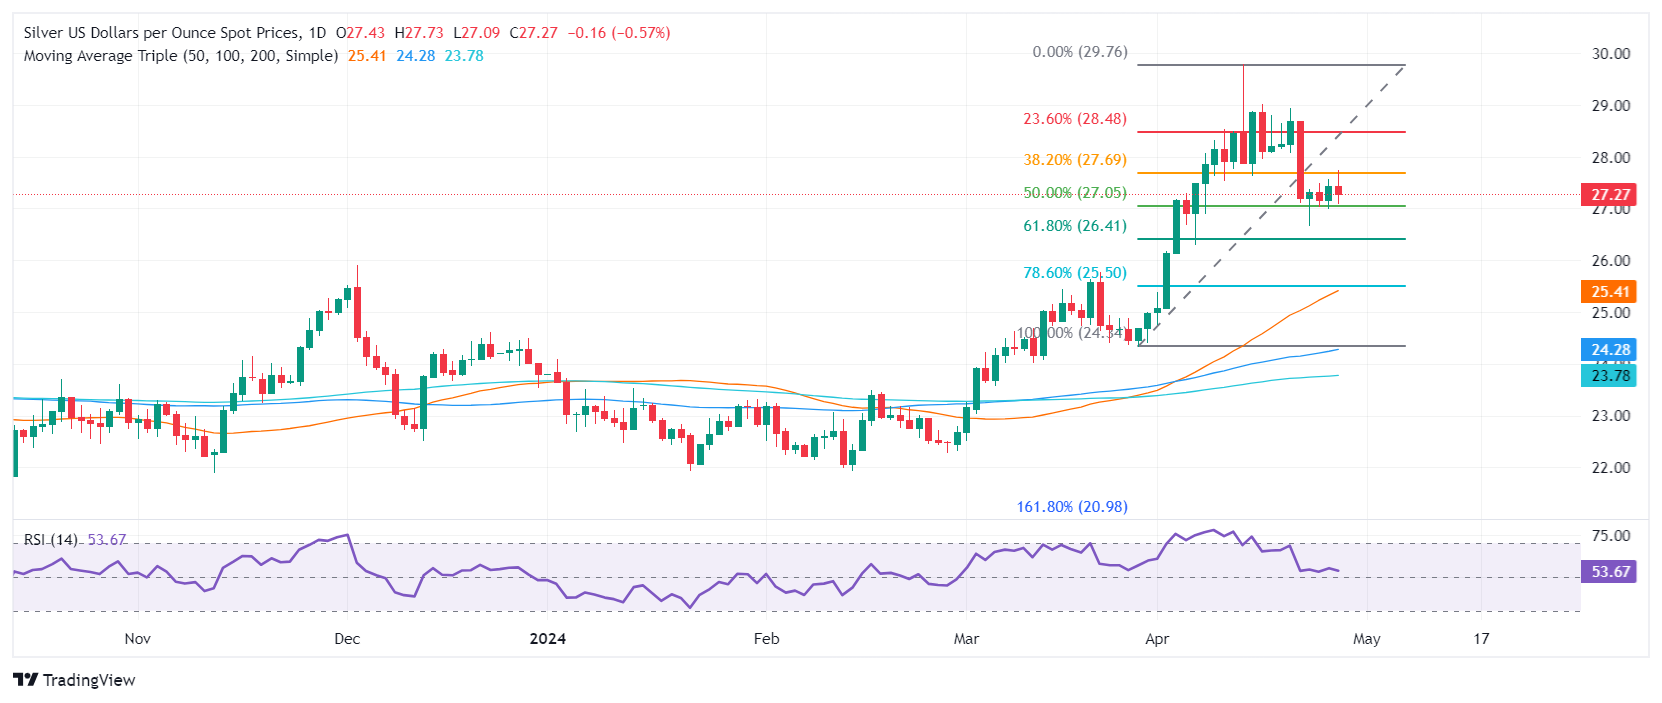
- Silver falls pulling back from a daily high of $27.73.
- Technical analysis indicates the uptrend is intact with key support at the $27.05 level, marked by the 50% Fibonacci retracement.
- If silver surpasses the $28.00 resistance, potential targets are $28.48 and possibly year highs near $29.76.
- Conversely, breaking below $27.05 could lead to $26.41 and further declines.
Silver's price dropped 0.79% after hitting a daily high of $27.73, as another inflation report in the United States showed warmer-than-expected inflation. The grey metal failed to capitalize on the fall in US Treasury yields, courtesy of a stronger US Dollar. At the time of writing, the XAG/USD trades at $27.21.
XAG/USD Price Analysis: Technical outlook
Despite retracing, the XAG/USD uptrend is intact, with dips viewed as opportunities for buyers to keep Silver's bid. During the last four trading days, Silver sellers had remained unable to push prices below the 50% Fibonacci retracement at $27.05, of the Fib drawn from the swing low at $24.34 to the latest high at $29.76.
For a bullish resumption, once traders surpass the $28.00 figure, that would pave the way for further upside. The first resistance would be the 23.6% Fib retracement at $28.48, followed by the $29.00 mark. The next supply area would be the year-to-date (YTD) high at $29.76.
On the flip side, bears could find some relief if XAG/USD slides below the 50% Fib retracement at $27.05, followed by the 61.8% retracement at $26.41. A subsequent dip is seen below that level, exposing the confluence of the 50-day moving average (DMA) and the 78.6% Fib retracement at $25.50.
XAG/USD Price Action – Daily Chart


© 2000-2026. Bản quyền Teletrade.
Trang web này được quản lý bởi Teletrade D.J. LLC 2351 LLC 2022 (Euro House, Richmond Hill Road, Kingstown, VC0100, St. Vincent and the Grenadines).
Thông tin trên trang web không phải là cơ sở để đưa ra quyết định đầu tư và chỉ được cung cấp cho mục đích làm quen.
Giao dịch trên thị trường tài chính (đặc biệt là giao dịch sử dụng các công cụ biên) mở ra những cơ hội lớn và tạo điều kiện cho các nhà đầu tư sẵn sàng mạo hiểm để thu lợi nhuận, tuy nhiên nó mang trong mình nguy cơ rủi ro khá cao. Chính vì vậy trước khi tiến hành giao dịch cần phải xem xét mọi mặt vấn đề chấp nhận tiến hành giao dịch cụ thể xét theo quan điểm của nguồn lực tài chính sẵn có và mức độ am hiểu thị trường tài chính.
Sử dụng thông tin: sử dụng toàn bộ hay riêng biệt các dữ liệu trên trang web của công ty TeleTrade như một nguồn cung cấp thông tin nhất định. Việc sử dụng tư liệu từ trang web cần kèm theo liên kết đến trang teletrade.vn. Việc tự động thu thập số liệu cũng như thông tin từ trang web TeleTrade đều không được phép.
Xin vui lòng liên hệ với pr@teletrade.global nếu có câu hỏi.
ngân hàng