- Phân tích
- Tin tức và các công cụ
- Tin tức thị trường
- GBP/USD Price Analysis: Climbs above 1.2500, with bulls targeting 200-DMA
GBP/USD Price Analysis: Climbs above 1.2500, with bulls targeting 200-DMA
- GBP/USD rises, rebounding from 1.2474 amid rumors impacting the US Dollar.
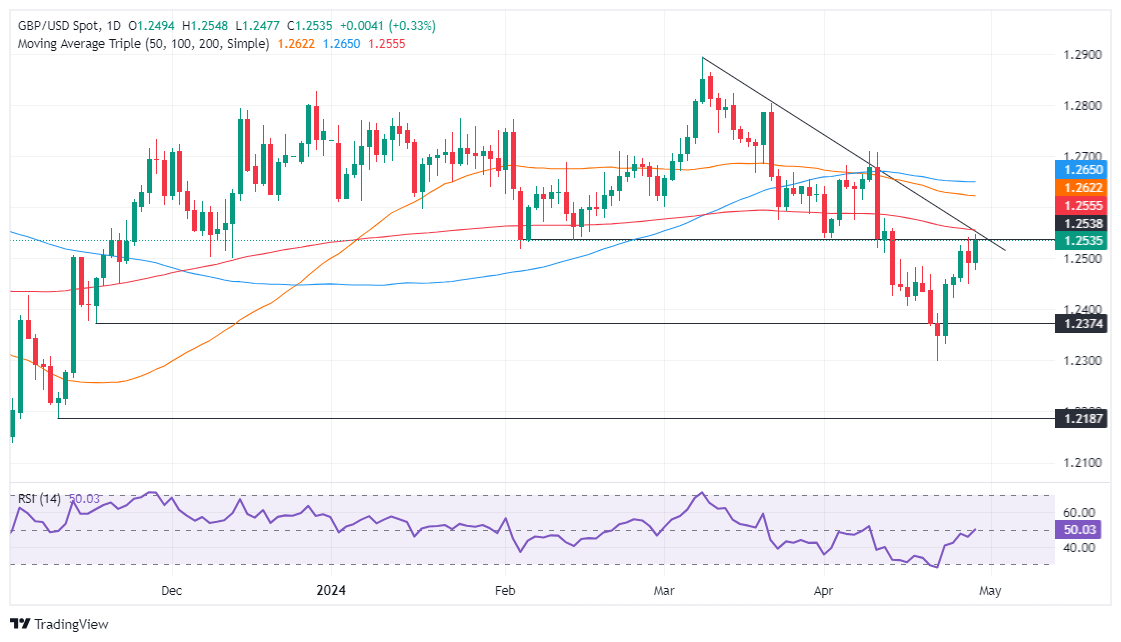
- Currently, GBP/USD tests the 200-day moving average at 1.2555, showing a neutral to slight bearish outlook.
- Breaking above the 200-DMA may target 1.2600, with potential further gains to 1.2621 and 1.2645.
- Failure to exceed the 200-DMA could prompt a retest of the 1.2500 support.
The Pound Sterling advanced sharply against the US Dollar in early trading during Monday’s North American session after hitting a daily low of 1.2474. Rumors of an intervention by Japanese authorities to propel the Japanese Yen (JPY) weighed on the Greenback, which is tumbling against most G8 FX currencies. Therefore, the GBP/USD trades at 1.2534, gaining 0.36%.
GBP/USD Price Analysis: Technical outlook
From a technical standpoint, the GBP/USD is neutral-biased, though tilted to the downside. It remains below the key 200-day moving average (DMA) at 1.2555, which delineates an asset's bullishness or bearishness. However, buyers are gathering momentum as the Relative Strength Index (RSI) punches above the 50-midline level.
With that context, if buyers achieve a daily close above the 200-DMA, that will expose the 1.2600 figure. Further upside is seen past the 50-DMA at 1.2621, followed by the 100-DMA at 1.2645. Once those levels are surpassed, the 1.2700 mark is up next.
Conversely, failure at the 200-DMA adds pressure on Sterling, which could drag the GBP/USD exchange rate beneath the 1.2500 mark. A breach of the latter will expose the April 24 low at 1.2422, followed by the April 22 low at 1.2299.
GBP/USD Price Action – Daily Chart


© 2000-2026. Bản quyền Teletrade.
Trang web này được quản lý bởi Teletrade D.J. LLC 2351 LLC 2022 (Euro House, Richmond Hill Road, Kingstown, VC0100, St. Vincent and the Grenadines).
Thông tin trên trang web không phải là cơ sở để đưa ra quyết định đầu tư và chỉ được cung cấp cho mục đích làm quen.
Giao dịch trên thị trường tài chính (đặc biệt là giao dịch sử dụng các công cụ biên) mở ra những cơ hội lớn và tạo điều kiện cho các nhà đầu tư sẵn sàng mạo hiểm để thu lợi nhuận, tuy nhiên nó mang trong mình nguy cơ rủi ro khá cao. Chính vì vậy trước khi tiến hành giao dịch cần phải xem xét mọi mặt vấn đề chấp nhận tiến hành giao dịch cụ thể xét theo quan điểm của nguồn lực tài chính sẵn có và mức độ am hiểu thị trường tài chính.
Sử dụng thông tin: sử dụng toàn bộ hay riêng biệt các dữ liệu trên trang web của công ty TeleTrade như một nguồn cung cấp thông tin nhất định. Việc sử dụng tư liệu từ trang web cần kèm theo liên kết đến trang teletrade.vn. Việc tự động thu thập số liệu cũng như thông tin từ trang web TeleTrade đều không được phép.
Xin vui lòng liên hệ với pr@teletrade.global nếu có câu hỏi.
ngân hàng