- Phân tích
- Tin tức và các công cụ
- Tin tức thị trường
- EUR/JPY Price Analysis: Bullish outlook prevails, despite sharp losses
EUR/JPY Price Analysis: Bullish outlook prevails, despite sharp losses
- The daily RSI of the EUR/JPY transitioned from its overbought threshold to near 60.
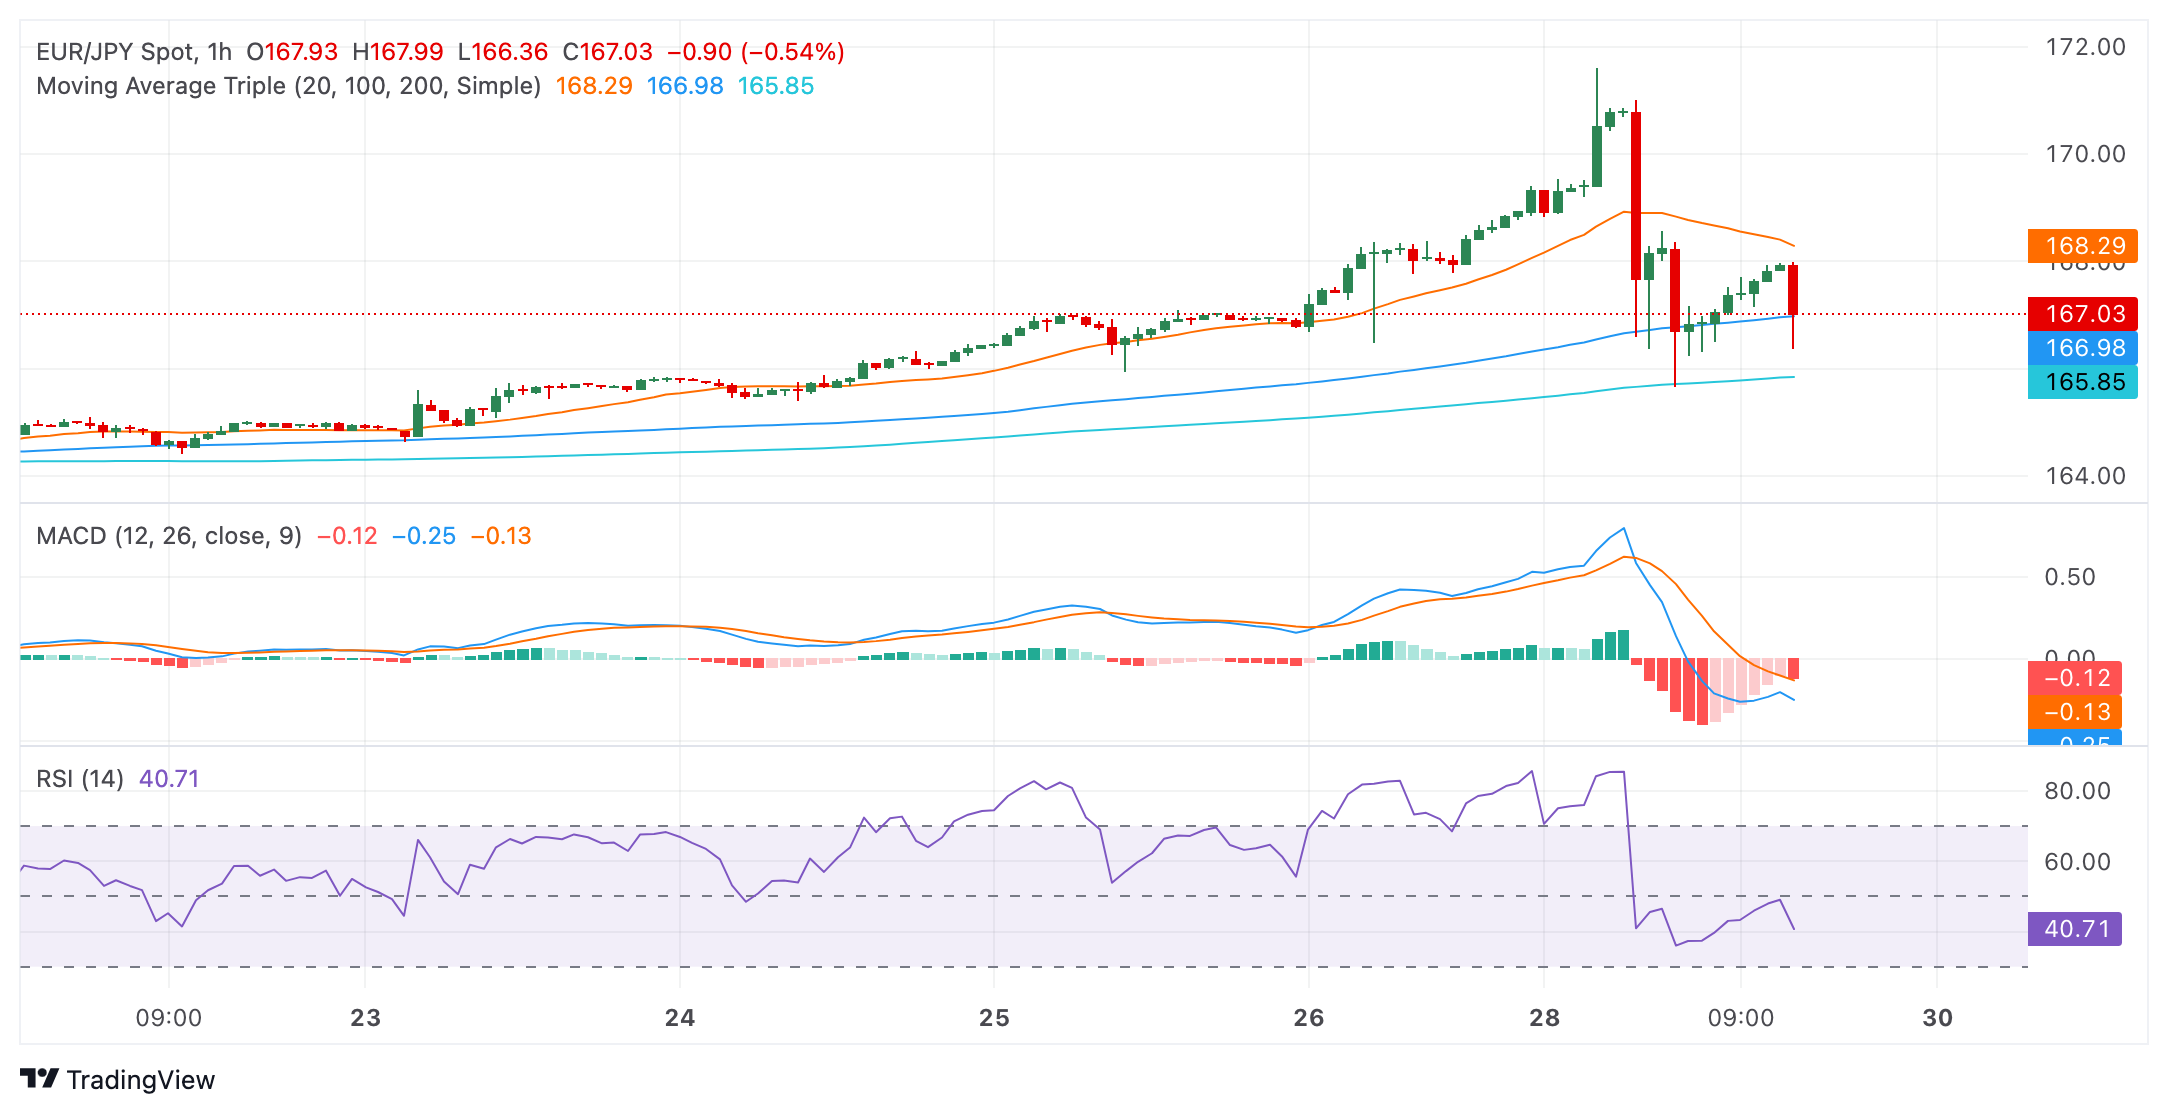
- In the hourly chart, the RSI reveals intense short-term bearish momentum, with the MACD also depicting increased negative bias.
- Any move below the primary SMAs could alter the bullish trend.
The EUR/JPY pair demonstrates resilience, bouncing back after encountering stern resistance at around the pivotal 165.50 landmark. Having faced a downward momentum of 0.90%, the pair skillfully remains above key Simple Moving Averages (SMAs), underlining the persistent bullish sentiment. Yet, market participants are encouraged to prepare for potential short-term adjustments, as bears are gaining ground.
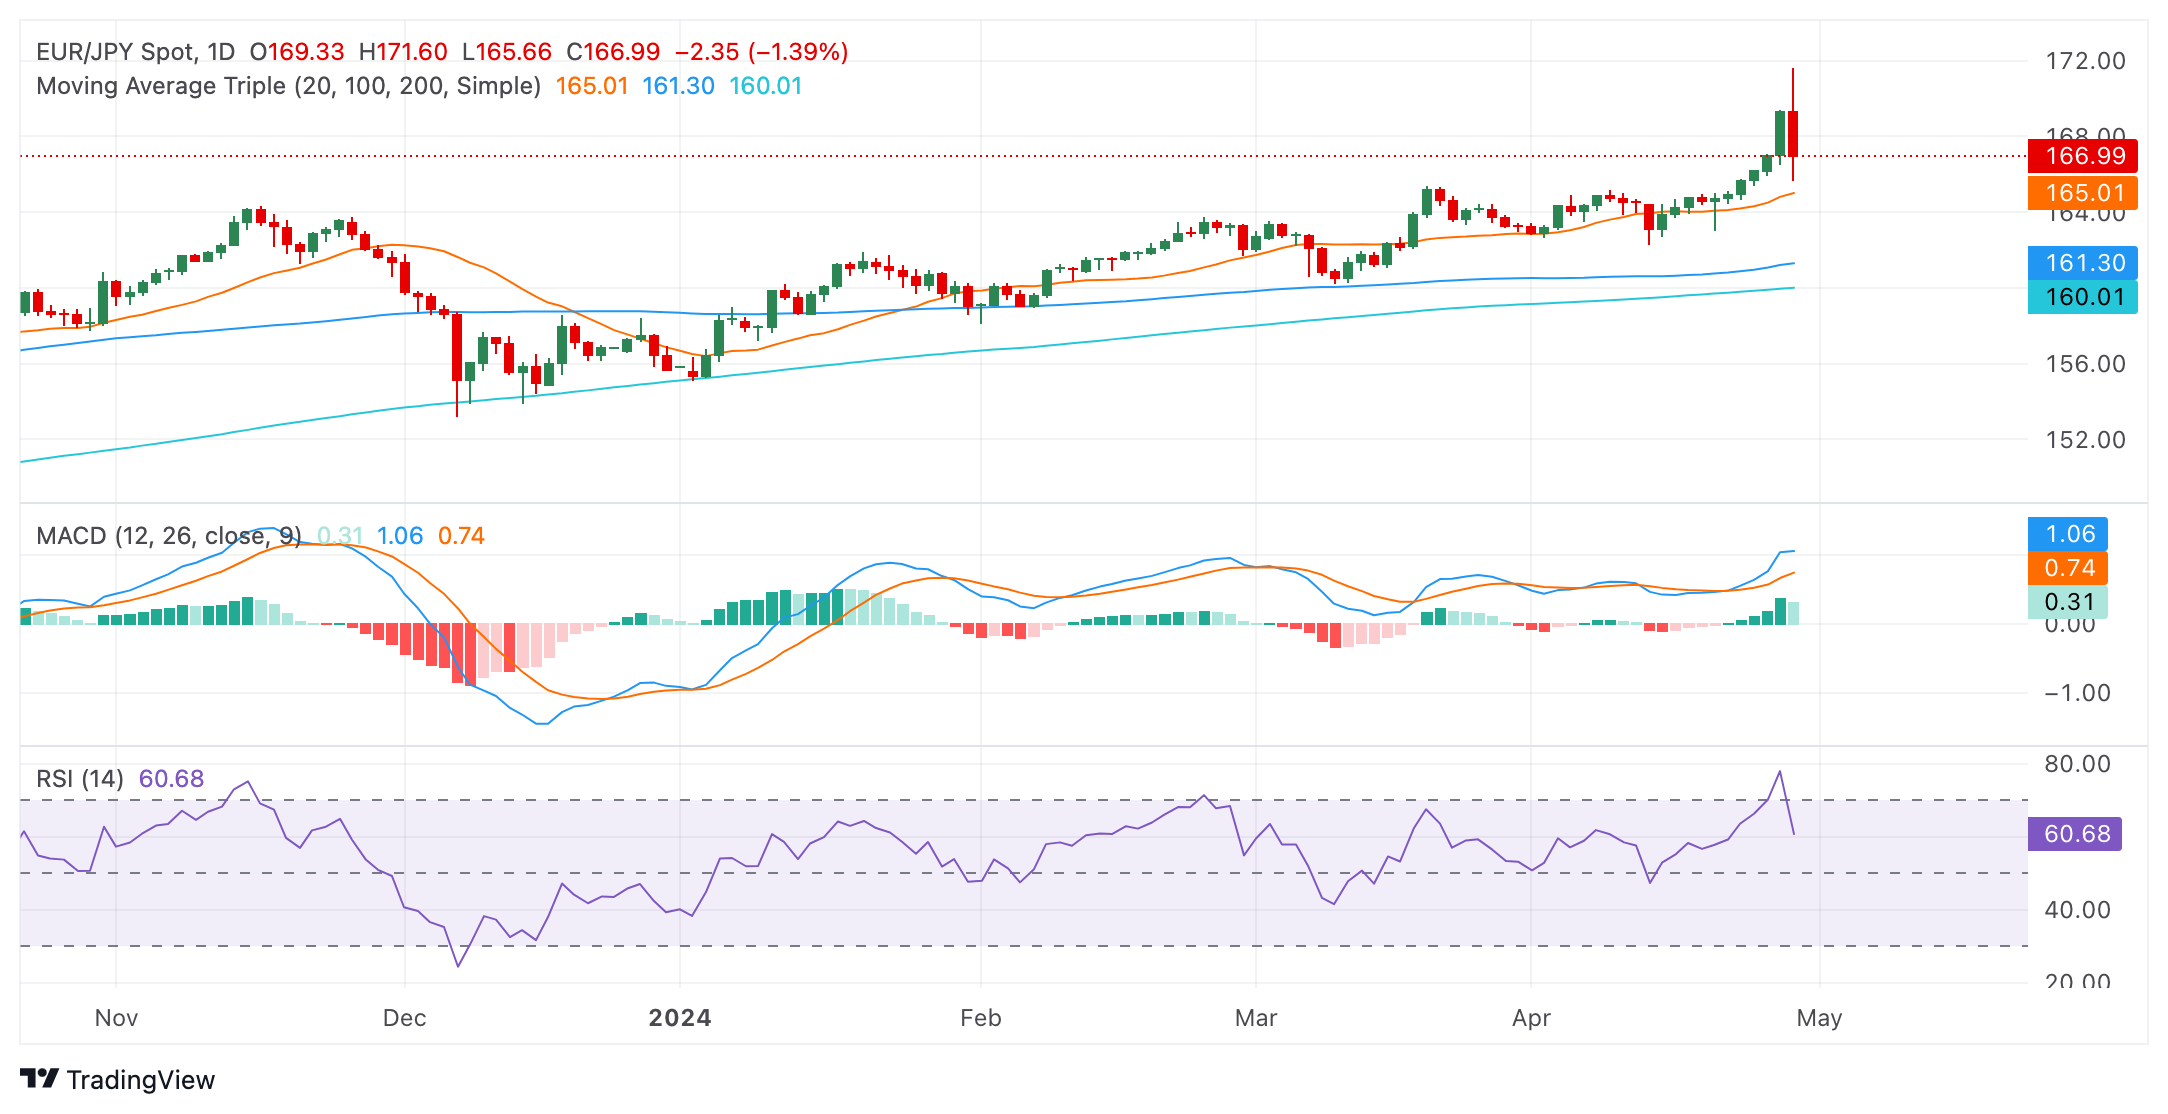
On the daily chart, the Relative Strength Index (RSI) took a big hit on Monday. Notwithstanding, the current value remains in the positive trend territory, potentially signaling the continuation of buying momentum. The Moving Average Convergence Divergence (MACD) prints decreasing green bars, suggesting that the tide might have turned in favor of the bears.
EUR/JPY daily chart
Turning to the hourly RSI, it is located in the negative territory. This situation highlights possible downward momentum, aligning with the downward trend depicted on the Moving Average Convergence Divergence (MACD) histogram, currently showing rising red bars, denoting strengthened negative momentum.
EUR/JPY hourly chart
Broadening the perspective, the EUR/JPY pair is positioned above the 20-day Simple Moving Average (SMA), having just bounced back strongly after meeting resistance at the crucial 165.50 level. This event furnishes a positive impression of the short-term trend. Additionally, the pair's placement above the 100 and 200-day SMA suggests an overall bullish long-term outlook. However, buyers shouldn’t call it a victory as bears are still around the corner.


© 2000-2026. Bản quyền Teletrade.
Trang web này được quản lý bởi Teletrade D.J. LLC 2351 LLC 2022 (Euro House, Richmond Hill Road, Kingstown, VC0100, St. Vincent and the Grenadines).
Thông tin trên trang web không phải là cơ sở để đưa ra quyết định đầu tư và chỉ được cung cấp cho mục đích làm quen.
Giao dịch trên thị trường tài chính (đặc biệt là giao dịch sử dụng các công cụ biên) mở ra những cơ hội lớn và tạo điều kiện cho các nhà đầu tư sẵn sàng mạo hiểm để thu lợi nhuận, tuy nhiên nó mang trong mình nguy cơ rủi ro khá cao. Chính vì vậy trước khi tiến hành giao dịch cần phải xem xét mọi mặt vấn đề chấp nhận tiến hành giao dịch cụ thể xét theo quan điểm của nguồn lực tài chính sẵn có và mức độ am hiểu thị trường tài chính.
Sử dụng thông tin: sử dụng toàn bộ hay riêng biệt các dữ liệu trên trang web của công ty TeleTrade như một nguồn cung cấp thông tin nhất định. Việc sử dụng tư liệu từ trang web cần kèm theo liên kết đến trang teletrade.vn. Việc tự động thu thập số liệu cũng như thông tin từ trang web TeleTrade đều không được phép.
Xin vui lòng liên hệ với pr@teletrade.global nếu có câu hỏi.
ngân hàng