- Phân tích
- Tin tức và các công cụ
- Tin tức thị trường
- AUD/JPY Price Analysis: Bulls ran out of steam and bears claim ground
AUD/JPY Price Analysis: Bulls ran out of steam and bears claim ground
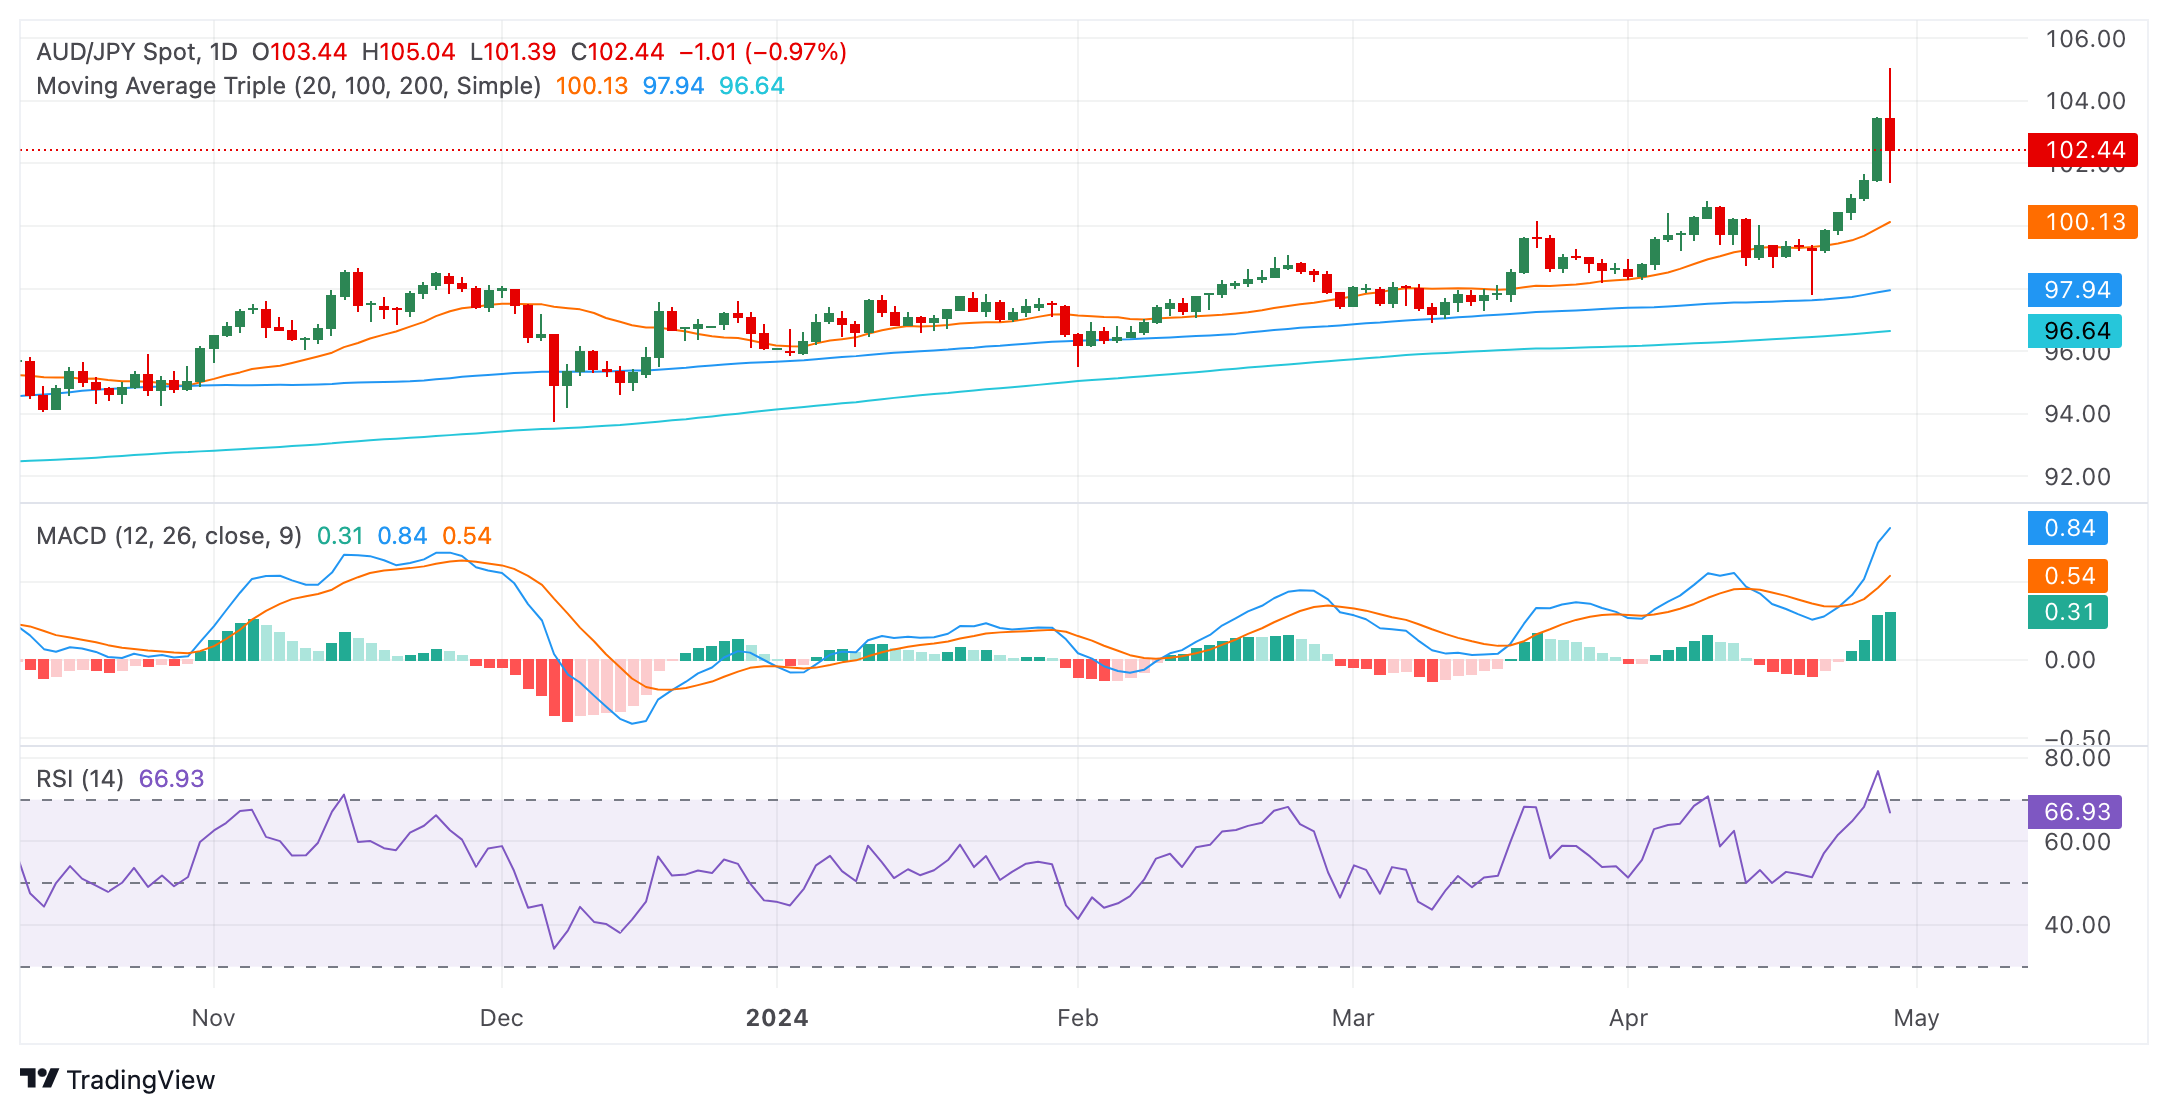
- The daily RSI suggests consistent buying momentum, with a slight dip indicating the possibility of a short-term correction.
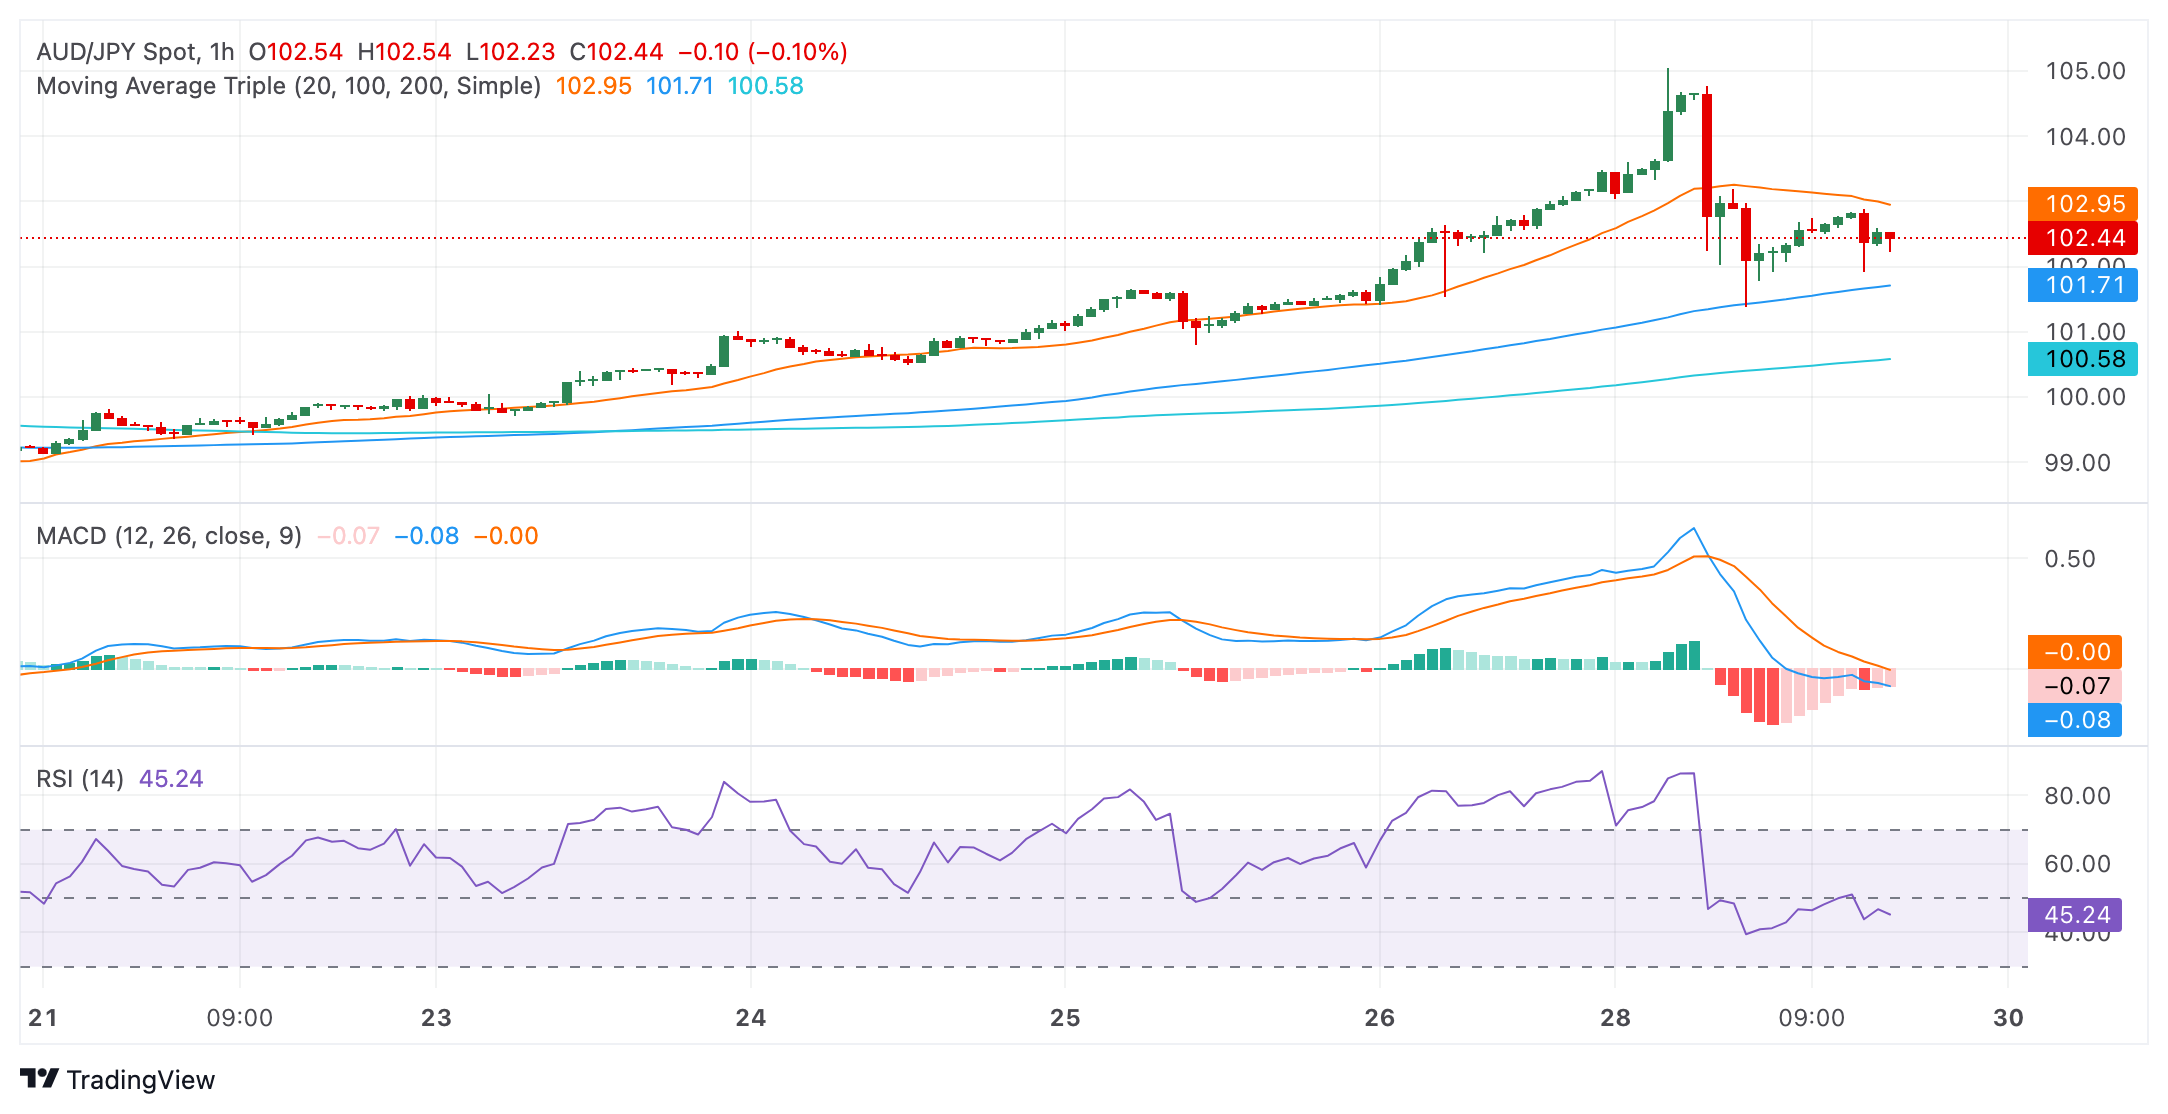
- The hourly RSI and MACD readings suggest mounting selling pressure in recent transactions.
The AUD/JPY trades at 102.43, demonstrating a pronounced bullish inclination despite Monday’s sharp losses. Indicators took a big hit and suggests that despite the bullish command, sellers are gaining ground.
On the daily chart, the Relative Strength Index (RSI) is seen trending within the overbought terrain, suggesting that buying activity has dominated the market action. A recent dip from overbought territory to 66 indicates potential for a short-term correction in the upcoming sessions. Meanwhile, the Moving Average Convergence Divergence (MACD) maintains flat green bars, signifying stable positive momentum.
AUD/JPY daily chart
Shifting to the hourly chart, the RSI readings reveal a contrasting scenario. The hourly RSI readings are trending in the negative territory, demonstrating that selling activity had a certain control in the latest trading hours. Moreover, the hourly MACD marks flat red bars, underlining a steady negative momentum.
AUD/JPY hourly chart
Observing the broader perspective, the AUD/JPY currently occupies a position above the 20, 100, and 200-day SMA. This stance underscores the prevailing bullish market sentiment in both short-term and long-term scenarios. In conclusion, while the daily indicators reflect an overall bullish sentiment, recent hourly readings suggest the potential for a short-term correction. Traders should monitor these contrasting signals closely as there might be a shift in the momentum in favor of the sellers and they might reclaim the 20-day SMA.


© 2000-2026. Bản quyền Teletrade.
Trang web này được quản lý bởi Teletrade D.J. LLC 2351 LLC 2022 (Euro House, Richmond Hill Road, Kingstown, VC0100, St. Vincent and the Grenadines).
Thông tin trên trang web không phải là cơ sở để đưa ra quyết định đầu tư và chỉ được cung cấp cho mục đích làm quen.
Giao dịch trên thị trường tài chính (đặc biệt là giao dịch sử dụng các công cụ biên) mở ra những cơ hội lớn và tạo điều kiện cho các nhà đầu tư sẵn sàng mạo hiểm để thu lợi nhuận, tuy nhiên nó mang trong mình nguy cơ rủi ro khá cao. Chính vì vậy trước khi tiến hành giao dịch cần phải xem xét mọi mặt vấn đề chấp nhận tiến hành giao dịch cụ thể xét theo quan điểm của nguồn lực tài chính sẵn có và mức độ am hiểu thị trường tài chính.
Sử dụng thông tin: sử dụng toàn bộ hay riêng biệt các dữ liệu trên trang web của công ty TeleTrade như một nguồn cung cấp thông tin nhất định. Việc sử dụng tư liệu từ trang web cần kèm theo liên kết đến trang teletrade.vn. Việc tự động thu thập số liệu cũng như thông tin từ trang web TeleTrade đều không được phép.
Xin vui lòng liên hệ với pr@teletrade.global nếu có câu hỏi.
ngân hàng