- Phân tích
- Tin tức và các công cụ
- Tin tức thị trường
- Silver Price Analysis: XAG/USD dips slightly, remains bullish above $27.00
Silver Price Analysis: XAG/USD dips slightly, remains bullish above $27.00
- Silver retreats from a high of $27.43 while interacting with key Fibonacci retracement levels.
- XAG/USD consolidates within the $27.05 to $27.70 Fibonacci range.
- A break above $27.70 could open the path to higher resistances at $28.00 and possibly extend towards the $29.00 mark and the annual high at $29.76.
- Should it fall below $27.05, Silver might target further supports at $26.41 and the crucial $25.50 level.
Silver's price edged down late during Monday’s North American session. It lost some 0.10% after reaching a daily high of $27.43 hit during the North American session. At the time of writing, XAG/USD trades at $27.12.
XAG/USD Price Analysis: Technical outlook
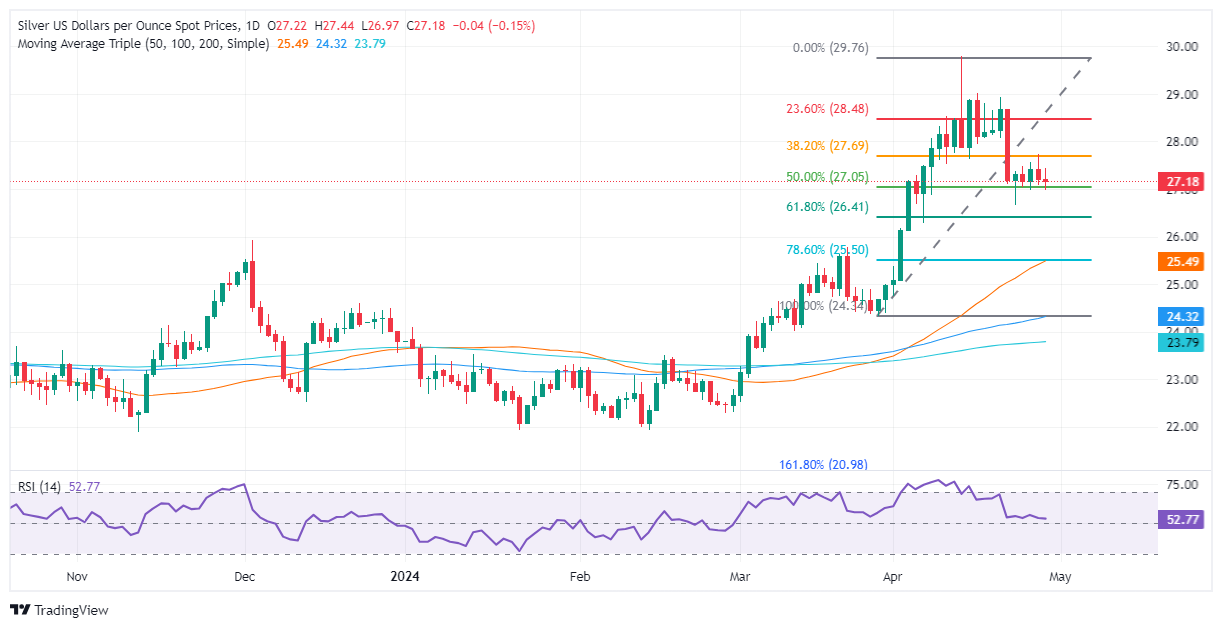
The XAG/USD daily chart suggests the grey metal is consolidating between 50% and 38.2% Fibonacci retracement, within the $27.05-$27.70 area of the Fib drawn from the swing low at $24.34 to the latest high at $29.76.
For a bullish continuation, traders need to reclaim the top of the abovementioned range at $27.70 so they can threaten to breach the $28.00 milestone. Once cleared, the next resistance would be the 23.6% Fib retracement at $28.48, followed by the $29.00 mark. The next supply area would be the year-to-date (YTD) high at $29.76.
On the flip side, bears could find some relief if XAG/USD slides below the 50% Fib retracement at $27.05, followed by the 61.8% retracement at $26.41. A subsequent dip is seen below that level, exposing the confluence of the 50-day moving average (DMA) and the 78.6% Fib retracement at $25.50.
XAG/USD Price Action – Daily Chart


© 2000-2026. Bản quyền Teletrade.
Trang web này được quản lý bởi Teletrade D.J. LLC 2351 LLC 2022 (Euro House, Richmond Hill Road, Kingstown, VC0100, St. Vincent and the Grenadines).
Thông tin trên trang web không phải là cơ sở để đưa ra quyết định đầu tư và chỉ được cung cấp cho mục đích làm quen.
Giao dịch trên thị trường tài chính (đặc biệt là giao dịch sử dụng các công cụ biên) mở ra những cơ hội lớn và tạo điều kiện cho các nhà đầu tư sẵn sàng mạo hiểm để thu lợi nhuận, tuy nhiên nó mang trong mình nguy cơ rủi ro khá cao. Chính vì vậy trước khi tiến hành giao dịch cần phải xem xét mọi mặt vấn đề chấp nhận tiến hành giao dịch cụ thể xét theo quan điểm của nguồn lực tài chính sẵn có và mức độ am hiểu thị trường tài chính.
Sử dụng thông tin: sử dụng toàn bộ hay riêng biệt các dữ liệu trên trang web của công ty TeleTrade như một nguồn cung cấp thông tin nhất định. Việc sử dụng tư liệu từ trang web cần kèm theo liên kết đến trang teletrade.vn. Việc tự động thu thập số liệu cũng như thông tin từ trang web TeleTrade đều không được phép.
Xin vui lòng liên hệ với pr@teletrade.global nếu có câu hỏi.
ngân hàng