- Phân tích
- Tin tức và các công cụ
- Tin tức thị trường
- USD/CAD Price Analysis: Hovers near 1.3700 within the ascending channel
USD/CAD Price Analysis: Hovers near 1.3700 within the ascending channel
- USD/CAD could gain ground as technical analysis indicates a recovery of bullish sentiment.
- A break above 1.3800 could lead the pair to revisit its five-month high of 1.3846.
- A breach below the channel’s lower boundary around 1.3630 could weaken the bullish sentiment.
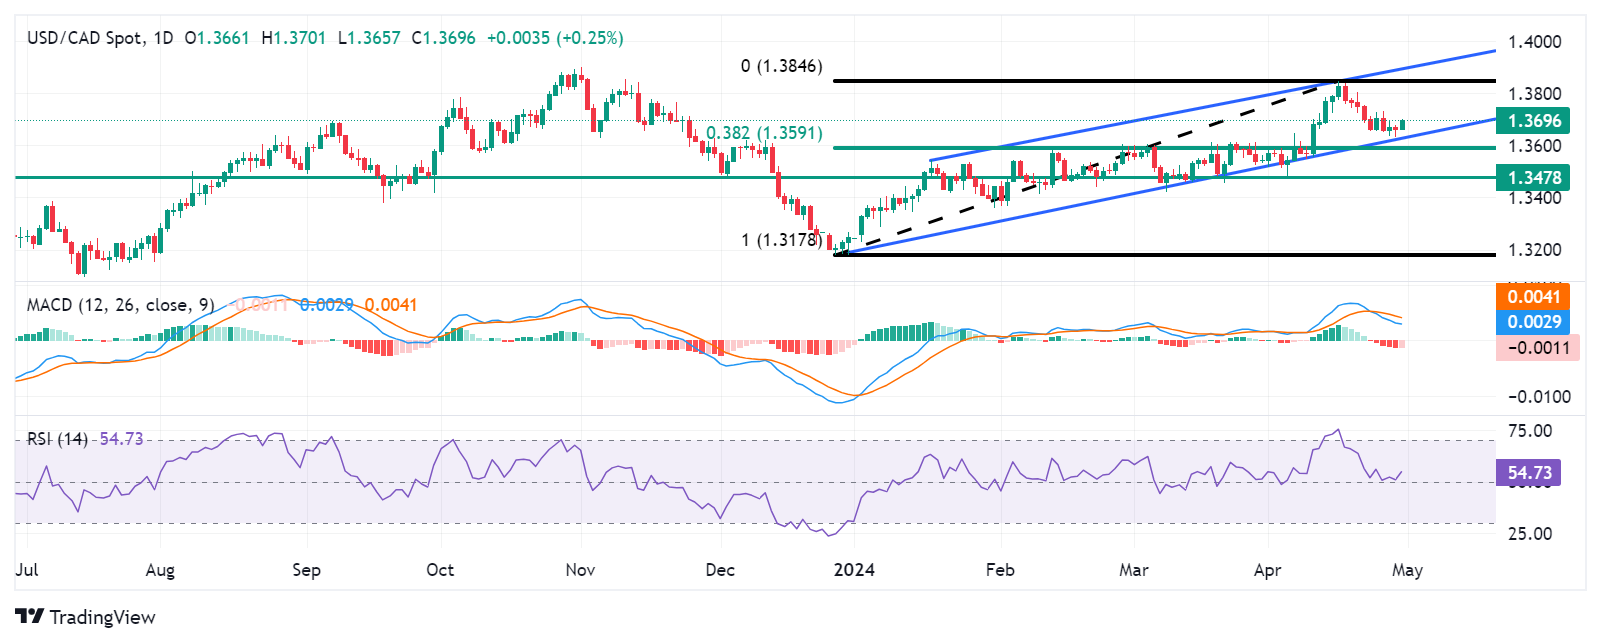
USD/CAD consolidates within the ascending channel on the daily chart, with the 14-day Relative Strength Index (RSI) positioned above 50, indicating a recovery of bullish sentiment. The pair edges higher to near 1.3700 during the European session on Tuesday.
Moreover, the Moving Average Convergence Divergence (MACD) line is above the centerline, signaling bullish momentum, although it remains below the signal line. Traders may look for confirmation from the MACD, a lagging indicator, to ascertain the direction of the trend.
The USD/CAD pair may encounter resistance near the psychological level of 1.3800. A breakthrough above this level could pave the way for the pair to revisit its five-month high of 1.3846, followed by the upper boundary of the ascending channel and the psychological barrier of 1.3900.
On the downside, the USD/CAD pair might test the lower boundary of the channel around the 1.3630 level. A breach below this level could exert downward pressure on the pair, leading it toward the region around the psychological support at 1.3600 and the 38.2% Fibonacci retracement level of 1.3591, plotted between the levels of 1.3178 and 1.3846.
The next significant support level lies at 1.3478, should the USD/CAD pair experience further depreciation, followed by December’s low at 1.3178.
USD/CAD: Daily Chart


© 2000-2026. Bản quyền Teletrade.
Trang web này được quản lý bởi Teletrade D.J. LLC 2351 LLC 2022 (Euro House, Richmond Hill Road, Kingstown, VC0100, St. Vincent and the Grenadines).
Thông tin trên trang web không phải là cơ sở để đưa ra quyết định đầu tư và chỉ được cung cấp cho mục đích làm quen.
Giao dịch trên thị trường tài chính (đặc biệt là giao dịch sử dụng các công cụ biên) mở ra những cơ hội lớn và tạo điều kiện cho các nhà đầu tư sẵn sàng mạo hiểm để thu lợi nhuận, tuy nhiên nó mang trong mình nguy cơ rủi ro khá cao. Chính vì vậy trước khi tiến hành giao dịch cần phải xem xét mọi mặt vấn đề chấp nhận tiến hành giao dịch cụ thể xét theo quan điểm của nguồn lực tài chính sẵn có và mức độ am hiểu thị trường tài chính.
Sử dụng thông tin: sử dụng toàn bộ hay riêng biệt các dữ liệu trên trang web của công ty TeleTrade như một nguồn cung cấp thông tin nhất định. Việc sử dụng tư liệu từ trang web cần kèm theo liên kết đến trang teletrade.vn. Việc tự động thu thập số liệu cũng như thông tin từ trang web TeleTrade đều không được phép.
Xin vui lòng liên hệ với pr@teletrade.global nếu có câu hỏi.
ngân hàng