- Phân tích
- Tin tức và các công cụ
- Tin tức thị trường
- GBP/USD Price Analysis: Drops below 200-DMA, at cross-roads to resume downtrend
GBP/USD Price Analysis: Drops below 200-DMA, at cross-roads to resume downtrend
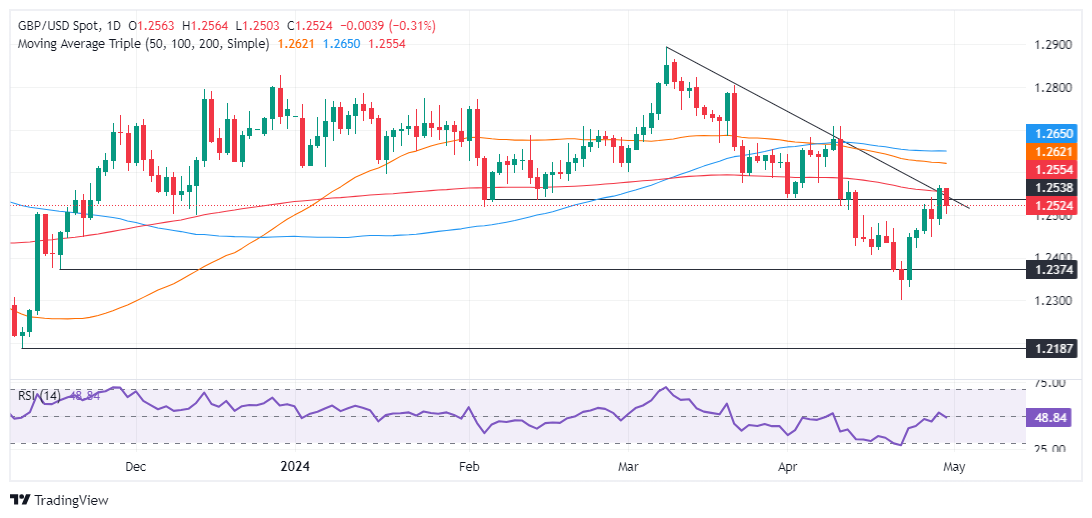
- GBP/USD declines 0.36% from its daily peak, under pressure from indications of rising US inflation.
- The pair struggles above the 200-day moving average at 1.2564, hinting at potential further declines.
- Support levels are seen at: November 14, 2023, high of 1.2506; breaching this could lead to further support tests at 1.2448 and the year-to-date low of 1.2299.
- A recovery above the 200-DMA could reignite bullish momentum, aiming for 1.2600, with additional resistance at the 50-DMA and 100-DMA at 1.2619 and 1.2645.
The Pound Sterling reverses its course against the US Dollar, after extending its gains past the 200-day moving average (DMA). However, data from the United States (US), showing that inflation could be picking up, as shown by the Employment Cost Index (ECI), bolstered the Greenback. Therefore, the GBP/USD trades at 1.2517 down by some 0.36%, after hitting a daily high of 1.2563.
GBP/USD Price Analysis: Technical outlook
The GBP/USD is neutral biased, though failure to cling above the 200-DMA at 1.2564 might open the door for a pullback, with traders eyeing a test of the November 14, 2023, high at 1.2506. In the event of a drop below that level, further downside is seen at the April 26 intermediate support at 1.2448, before the major plunges to the year-to-date (YTD) low of 1.2299.
On the other hand, if the pair edges above the 200-DMA that would pave the way for testing 1.2600. Once surpassed, key resistance levels emerge. The 50-DMA is up next at 1.2619, followed by the 100-DMA at 1.2645. Subsequent gains are seen above those levels, exacerbating a rally toward 1.2700.
GBP/USD Price Action – Daily Chart


© 2000-2026. Bản quyền Teletrade.
Trang web này được quản lý bởi Teletrade D.J. LLC 2351 LLC 2022 (Euro House, Richmond Hill Road, Kingstown, VC0100, St. Vincent and the Grenadines).
Thông tin trên trang web không phải là cơ sở để đưa ra quyết định đầu tư và chỉ được cung cấp cho mục đích làm quen.
Giao dịch trên thị trường tài chính (đặc biệt là giao dịch sử dụng các công cụ biên) mở ra những cơ hội lớn và tạo điều kiện cho các nhà đầu tư sẵn sàng mạo hiểm để thu lợi nhuận, tuy nhiên nó mang trong mình nguy cơ rủi ro khá cao. Chính vì vậy trước khi tiến hành giao dịch cần phải xem xét mọi mặt vấn đề chấp nhận tiến hành giao dịch cụ thể xét theo quan điểm của nguồn lực tài chính sẵn có và mức độ am hiểu thị trường tài chính.
Sử dụng thông tin: sử dụng toàn bộ hay riêng biệt các dữ liệu trên trang web của công ty TeleTrade như một nguồn cung cấp thông tin nhất định. Việc sử dụng tư liệu từ trang web cần kèm theo liên kết đến trang teletrade.vn. Việc tự động thu thập số liệu cũng như thông tin từ trang web TeleTrade đều không được phép.
Xin vui lòng liên hệ với pr@teletrade.global nếu có câu hỏi.
ngân hàng