- Phân tích
- Tin tức và các công cụ
- Tin tức thị trường
- NZD/JPY Price Analysis: Buyers step back to consolidate, sellers gain ground
NZD/JPY Price Analysis: Buyers step back to consolidate, sellers gain ground
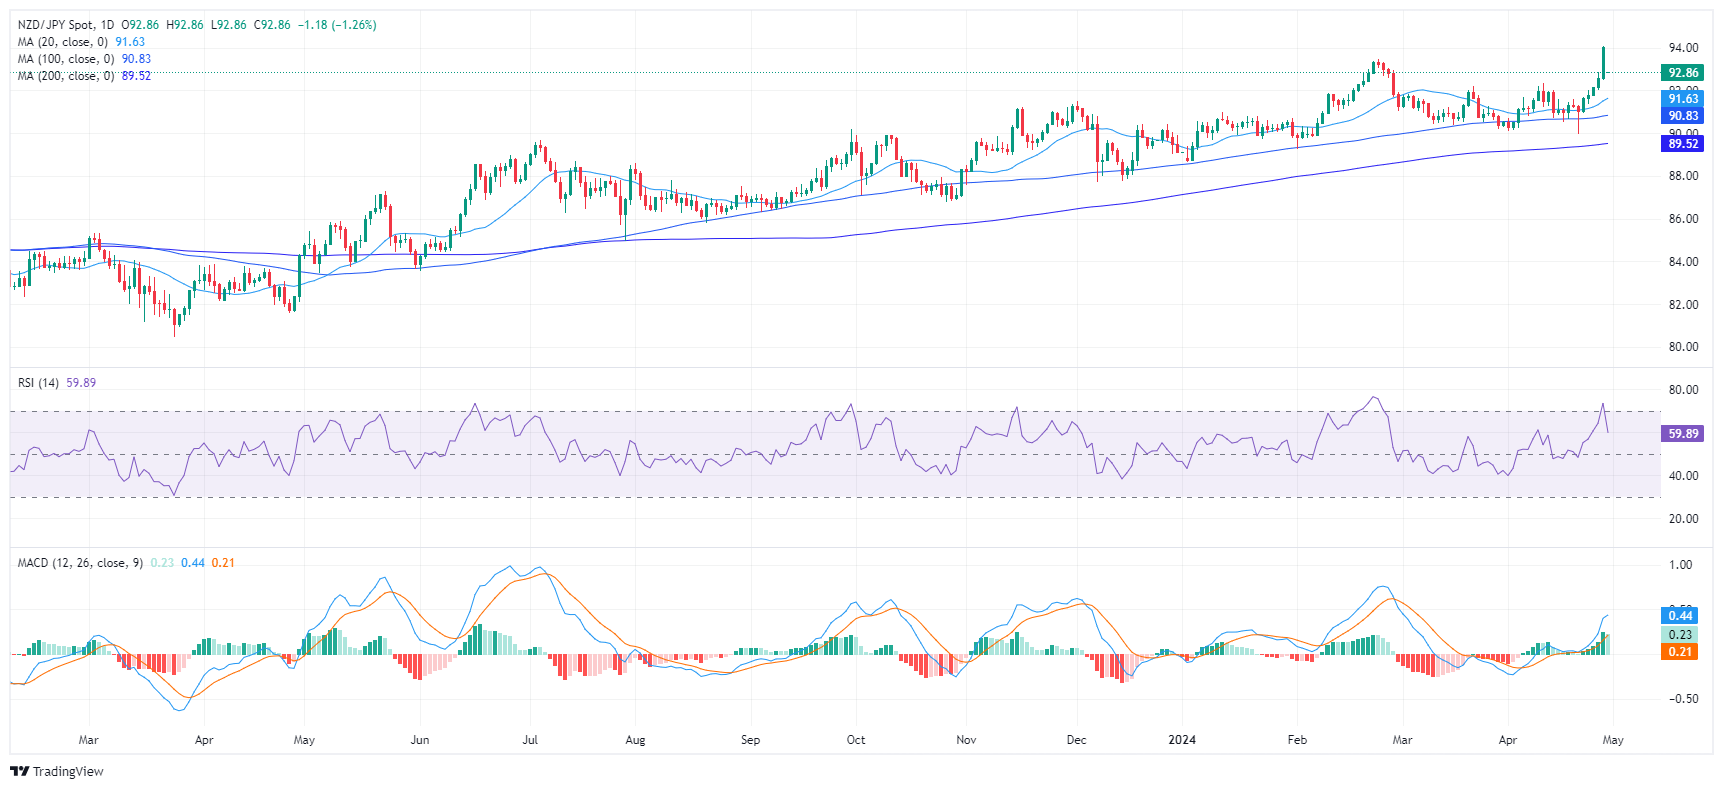
- The daily RSI for the NZD/JPY shows a decreasing trend, hinting at a growing bearish bias.
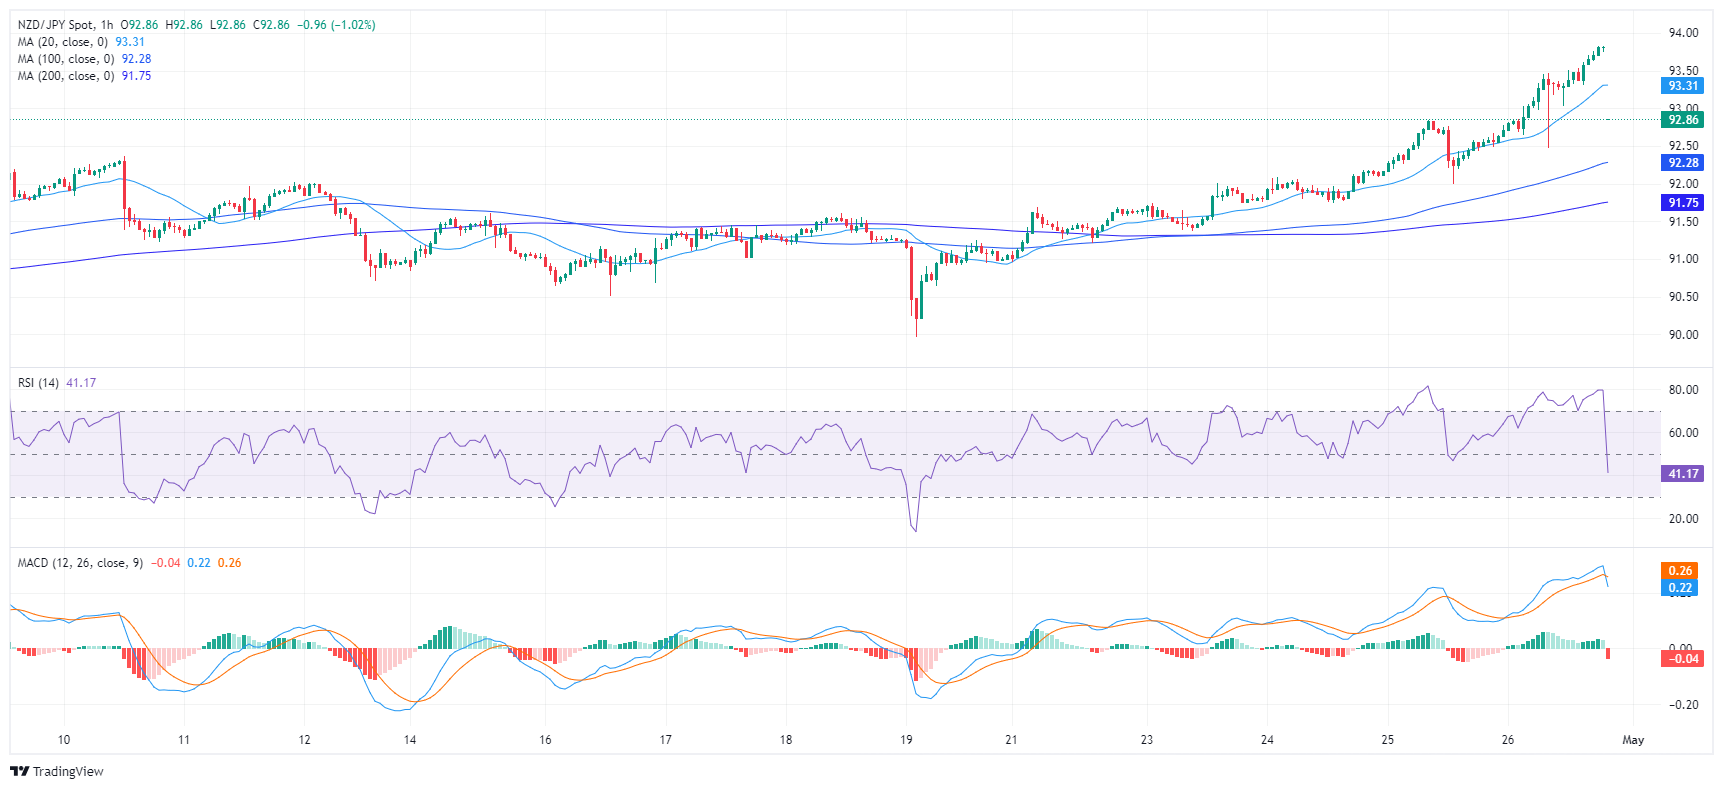
- On the hourly chart, both RSI and MACD reflect a growing bearish tendency, supporting the daily chart's sentiment.
- Any movements that leave the pair above its 20-day SMA won’t challenge the bullish outlook.
The NZD/JPY pair is down by 0.45% on Tuesday, trading at 92.99. Despite some bearish undertones, the NZD/JPY maintains a long-term bullish trend above its principal Simple Moving Averages (SMAs). There is potential for short-term momentum shifts, as investors are stepping back to take profits after propelling the pair to highs since 2015 on Monday.
On the daily chart, the Relative Strength Index (RSI) for NZD/JPY has decreased over the previous sessions. The index moved from overbought terrain to below 70 indicating a possible reversal or slowdown in the buyer’s traction.
NZD/JPY daily chart
Moving to an intraday basis, the hourly chart presents a similar scenario. The RSI plunged into negative territory. Simultaneously, the Moving Average Convergence Divergence (MACD) printed a red bars signaling a rising negative momentum. This indicates that investors continued taking profits on Tuesday and that the sellers commanded the trades during the session.
NZD/JPY hourly chart
From a broader perspective, NZD/JPY remains bullish despite the downside as it remains above its Simple Moving Averages (SMA) of 20,100, and 200-day periods. However, if the bears manage to gather additional momentum they might reclaim the 20-day SMA which may worsen the outlook for the pair in case of being lost.


© 2000-2026. Bản quyền Teletrade.
Trang web này được quản lý bởi Teletrade D.J. LLC 2351 LLC 2022 (Euro House, Richmond Hill Road, Kingstown, VC0100, St. Vincent and the Grenadines).
Thông tin trên trang web không phải là cơ sở để đưa ra quyết định đầu tư và chỉ được cung cấp cho mục đích làm quen.
Giao dịch trên thị trường tài chính (đặc biệt là giao dịch sử dụng các công cụ biên) mở ra những cơ hội lớn và tạo điều kiện cho các nhà đầu tư sẵn sàng mạo hiểm để thu lợi nhuận, tuy nhiên nó mang trong mình nguy cơ rủi ro khá cao. Chính vì vậy trước khi tiến hành giao dịch cần phải xem xét mọi mặt vấn đề chấp nhận tiến hành giao dịch cụ thể xét theo quan điểm của nguồn lực tài chính sẵn có và mức độ am hiểu thị trường tài chính.
Sử dụng thông tin: sử dụng toàn bộ hay riêng biệt các dữ liệu trên trang web của công ty TeleTrade như một nguồn cung cấp thông tin nhất định. Việc sử dụng tư liệu từ trang web cần kèm theo liên kết đến trang teletrade.vn. Việc tự động thu thập số liệu cũng như thông tin từ trang web TeleTrade đều không được phép.
Xin vui lòng liên hệ với pr@teletrade.global nếu có câu hỏi.
ngân hàng