- Phân tích
- Tin tức và các công cụ
- Tin tức thị trường
- USD/CHF Price Analysis: Extends the rally above 0.9200 amid the overbought condition
USD/CHF Price Analysis: Extends the rally above 0.9200 amid the overbought condition
- USD/CHF trades on a stronger note around 0.9210 ahead of the Fed rate decision on Wednesday.
- The pair keeps the bullish vibe with the overbought RSI condition.
- The first upside barrier is seen at 0.9245; the initial support level is located at 0.9155.
The USD/CHF pair extends its upside to 0.9210 on Wednesday during the early European session. A renewed US Dollar (USD) demand creates a tailwind to a major pair. Furthermore, the Fed is widely expected to keep the policy rate in its current 5.25%–5.50% range on Wednesday and continue to maintain the hawkish stance, which provides some support to the Greenback.
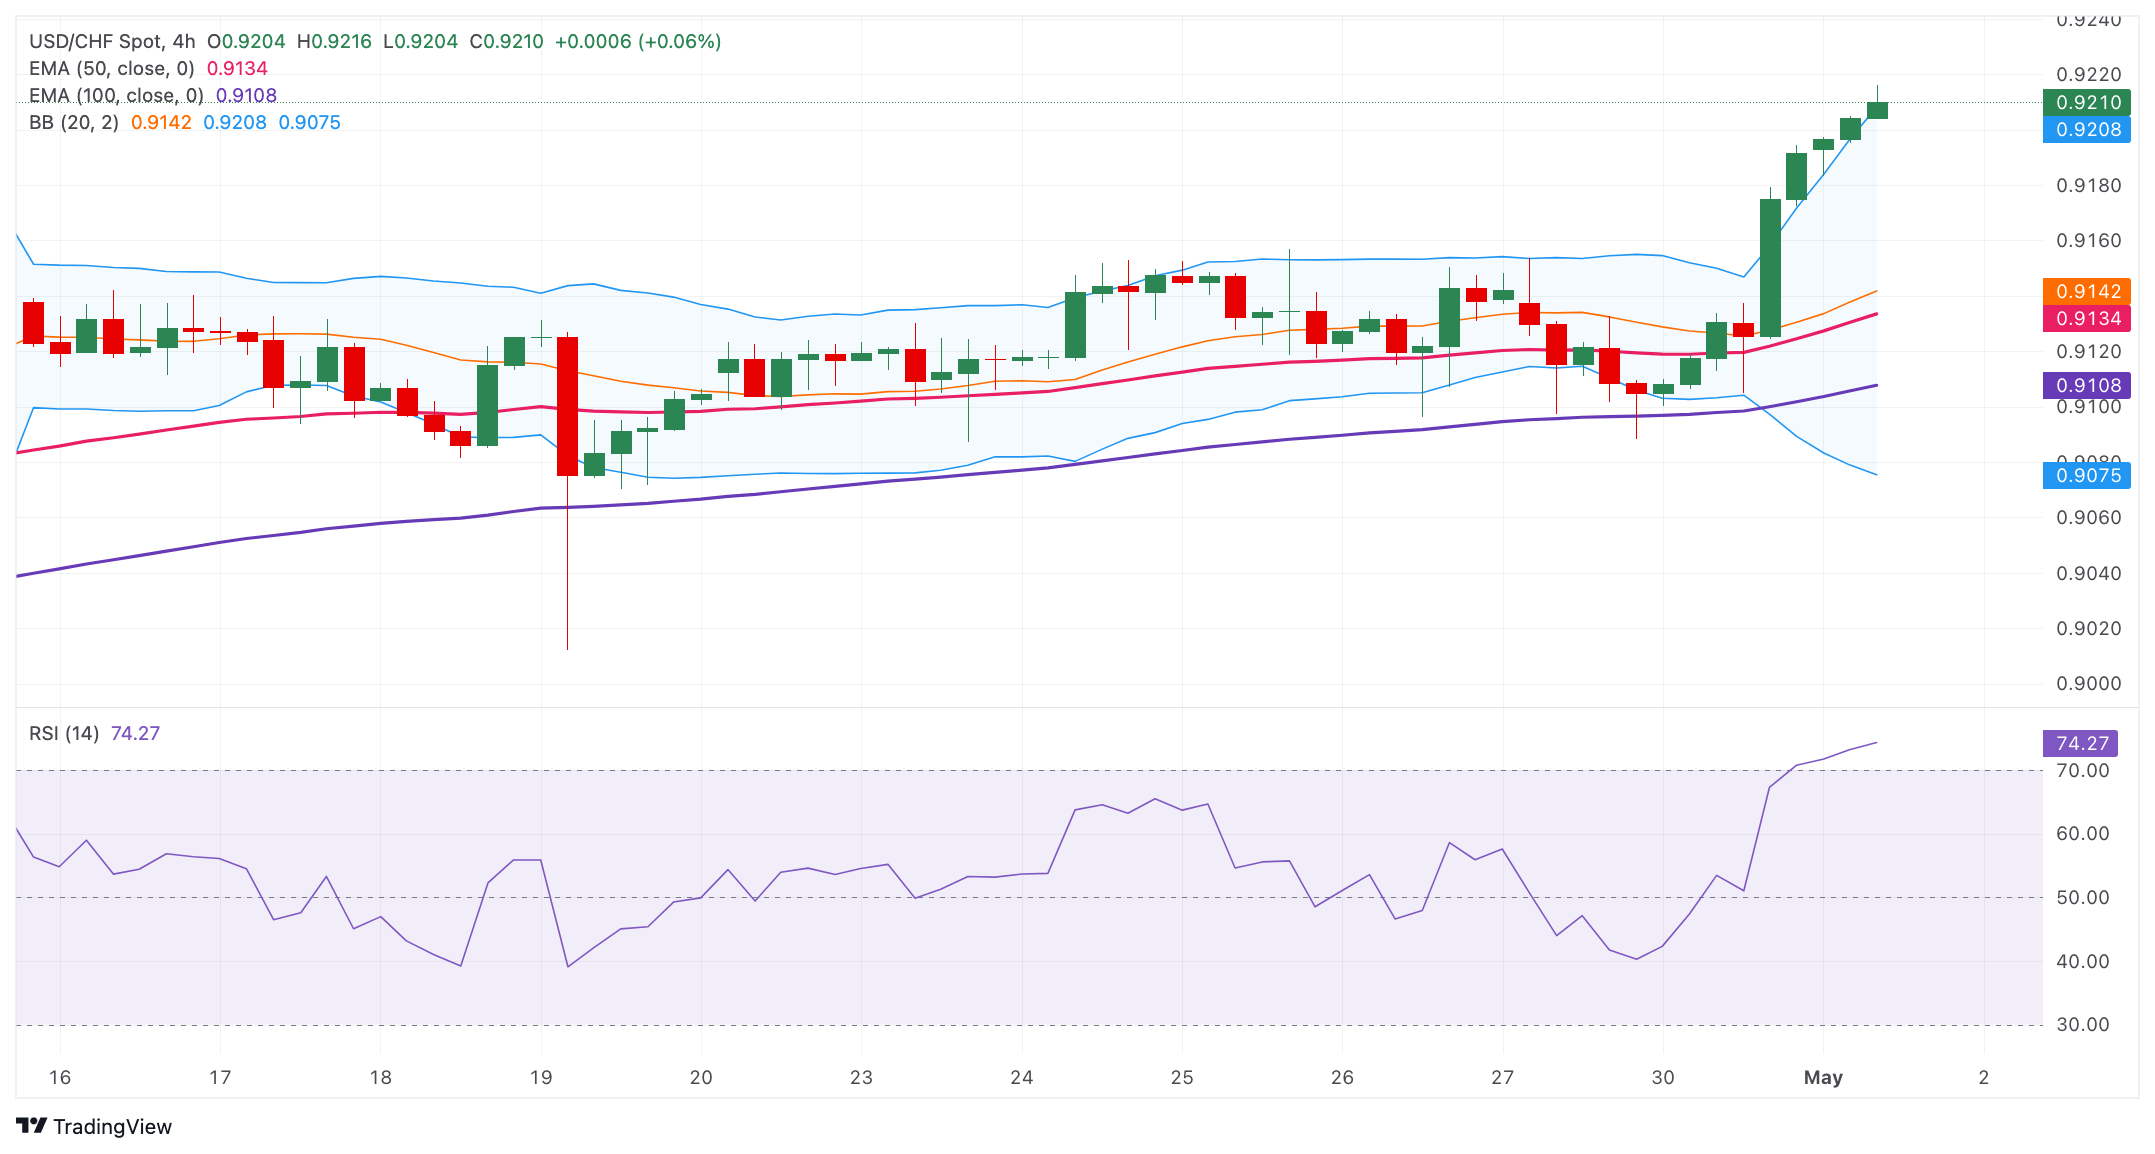
Technically, USD/CHF maintains the bullish outlook unchanged on the four-hour chart as the cross is above the key 50- and 100-period Exponential Moving Averages (EMAs). The Relative Strength Index (RSI) holds in bullish territory above the midline. However, the overbought RSI condition indicates that further consolidation cannot be ruled out before positioning for any near-term USD/CHF appreciation.
A decisive break above the upper boundary of the Bollinger Band at 0.9210 will see a rally to a high of October 3, 2023, at 0.9245. Any follow-through buying above this level will expose the 0.9300 psychological round mark. The next upside target is seen at a high of March 16, 2023, at 0.9340.
On the flip side, the initial support level for the cross will emerge near a high of April 29 at 0.9155. The additional downside filter to watch is the 50-period EMA at 0.9134. The key contention level is located at the 0.9100–0.9110 zone, representing the psychological figure and the 100-period EMA. A breach of the mentioned level will see a drop to the lower limit of the Bollinger Band at 0.9075.
USD/CHF four-hour chart


© 2000-2026. Bản quyền Teletrade.
Trang web này được quản lý bởi Teletrade D.J. LLC 2351 LLC 2022 (Euro House, Richmond Hill Road, Kingstown, VC0100, St. Vincent and the Grenadines).
Thông tin trên trang web không phải là cơ sở để đưa ra quyết định đầu tư và chỉ được cung cấp cho mục đích làm quen.
Giao dịch trên thị trường tài chính (đặc biệt là giao dịch sử dụng các công cụ biên) mở ra những cơ hội lớn và tạo điều kiện cho các nhà đầu tư sẵn sàng mạo hiểm để thu lợi nhuận, tuy nhiên nó mang trong mình nguy cơ rủi ro khá cao. Chính vì vậy trước khi tiến hành giao dịch cần phải xem xét mọi mặt vấn đề chấp nhận tiến hành giao dịch cụ thể xét theo quan điểm của nguồn lực tài chính sẵn có và mức độ am hiểu thị trường tài chính.
Sử dụng thông tin: sử dụng toàn bộ hay riêng biệt các dữ liệu trên trang web của công ty TeleTrade như một nguồn cung cấp thông tin nhất định. Việc sử dụng tư liệu từ trang web cần kèm theo liên kết đến trang teletrade.vn. Việc tự động thu thập số liệu cũng như thông tin từ trang web TeleTrade đều không được phép.
Xin vui lòng liên hệ với pr@teletrade.global nếu có câu hỏi.
ngân hàng