- Phân tích
- Tin tức và các công cụ
- Tin tức thị trường
- GBP/USD Price Analysis: Tumbles below crucial 1.2500 as bears move in
GBP/USD Price Analysis: Tumbles below crucial 1.2500 as bears move in
- GBP/USD drops 0.30%, US Dollar rises on positive US trade and labor data.
- The GBP/USD struggles below 200-DMA at 1.2550, trending down.
- RSI indicates bearish momentum; sellers control the market.
- Recovery above 1.2500 could retest 200-DMA, with resistance at 1.2569 and 50-DMA at 1.2613.
The Pound Sterling tumbled in early trading during the North American session, dropping below the 1.2500 figure amid renewed US Dollar strength. Data from the United States showed that the Balance of Trade deficit tightened while the labor market remained tight, as revealed by the Initial Jobless Claims report. The GBP/USD trades at 1.2488, down 0.30%.
GBP/USD Price Analysis: Technical outlook
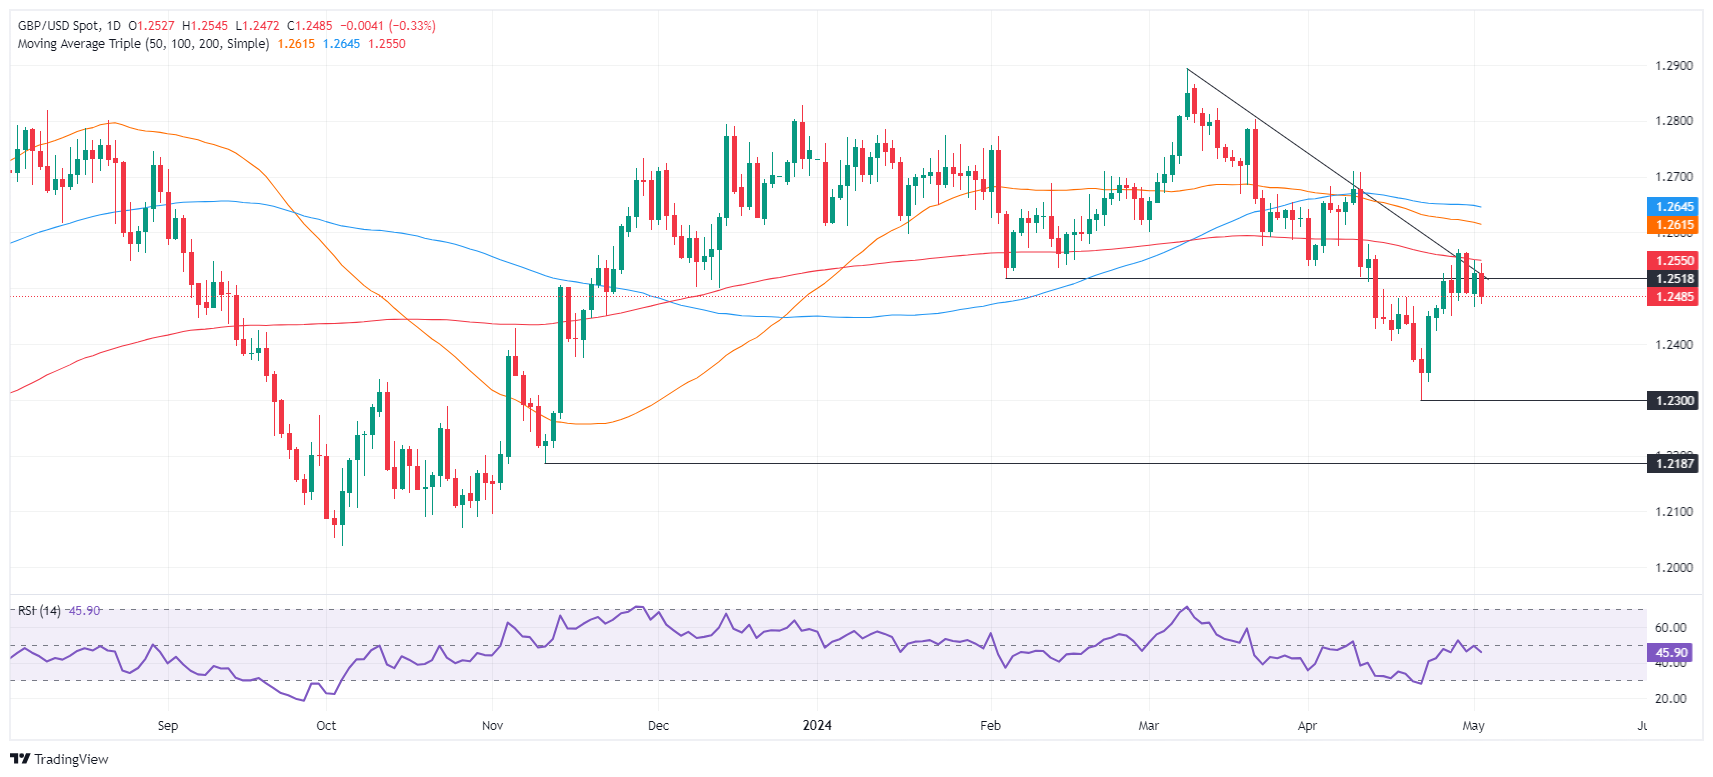
From a technical standpoint, the GBP/USD is showing a neutral to downward bias. This is a result of buyers failing to breach the significant resistance at the 200-day moving average (DMA) at 1.2550. This failure has further intensified the major’s drop below the 1.2500 figure, potentially paving the way for a test of the latest cycle low seen at 1.2299, the April 22 low.
Momentum points to a continuation of the downtrend, as the Relative Strength Index (RSI) turned bearish on April 30. As of writing, it aims downward, meaning sellers remain in charge.
On the other hand, if buyers reclaim 1.2500, they must reclaim the 200-DMA ahead of testing the April 29 high at 1.2569. Once cleared, the next stop would be the 1.2600 mark, followed by the 50-DMA at 1.2613. Further gains are seen above the 100-DMA at 1.2644.
GBP/USD Price Action – Daily Chart


© 2000-2026. Bản quyền Teletrade.
Trang web này được quản lý bởi Teletrade D.J. LLC 2351 LLC 2022 (Euro House, Richmond Hill Road, Kingstown, VC0100, St. Vincent and the Grenadines).
Thông tin trên trang web không phải là cơ sở để đưa ra quyết định đầu tư và chỉ được cung cấp cho mục đích làm quen.
Giao dịch trên thị trường tài chính (đặc biệt là giao dịch sử dụng các công cụ biên) mở ra những cơ hội lớn và tạo điều kiện cho các nhà đầu tư sẵn sàng mạo hiểm để thu lợi nhuận, tuy nhiên nó mang trong mình nguy cơ rủi ro khá cao. Chính vì vậy trước khi tiến hành giao dịch cần phải xem xét mọi mặt vấn đề chấp nhận tiến hành giao dịch cụ thể xét theo quan điểm của nguồn lực tài chính sẵn có và mức độ am hiểu thị trường tài chính.
Sử dụng thông tin: sử dụng toàn bộ hay riêng biệt các dữ liệu trên trang web của công ty TeleTrade như một nguồn cung cấp thông tin nhất định. Việc sử dụng tư liệu từ trang web cần kèm theo liên kết đến trang teletrade.vn. Việc tự động thu thập số liệu cũng như thông tin từ trang web TeleTrade đều không được phép.
Xin vui lòng liên hệ với pr@teletrade.global nếu có câu hỏi.
ngân hàng