- Phân tích
- Tin tức và các công cụ
- Tin tức thị trường
- EUR/JPY Price Analysis: Bearish sentiment takes over, 20-day SMA lost
EUR/JPY Price Analysis: Bearish sentiment takes over, 20-day SMA lost
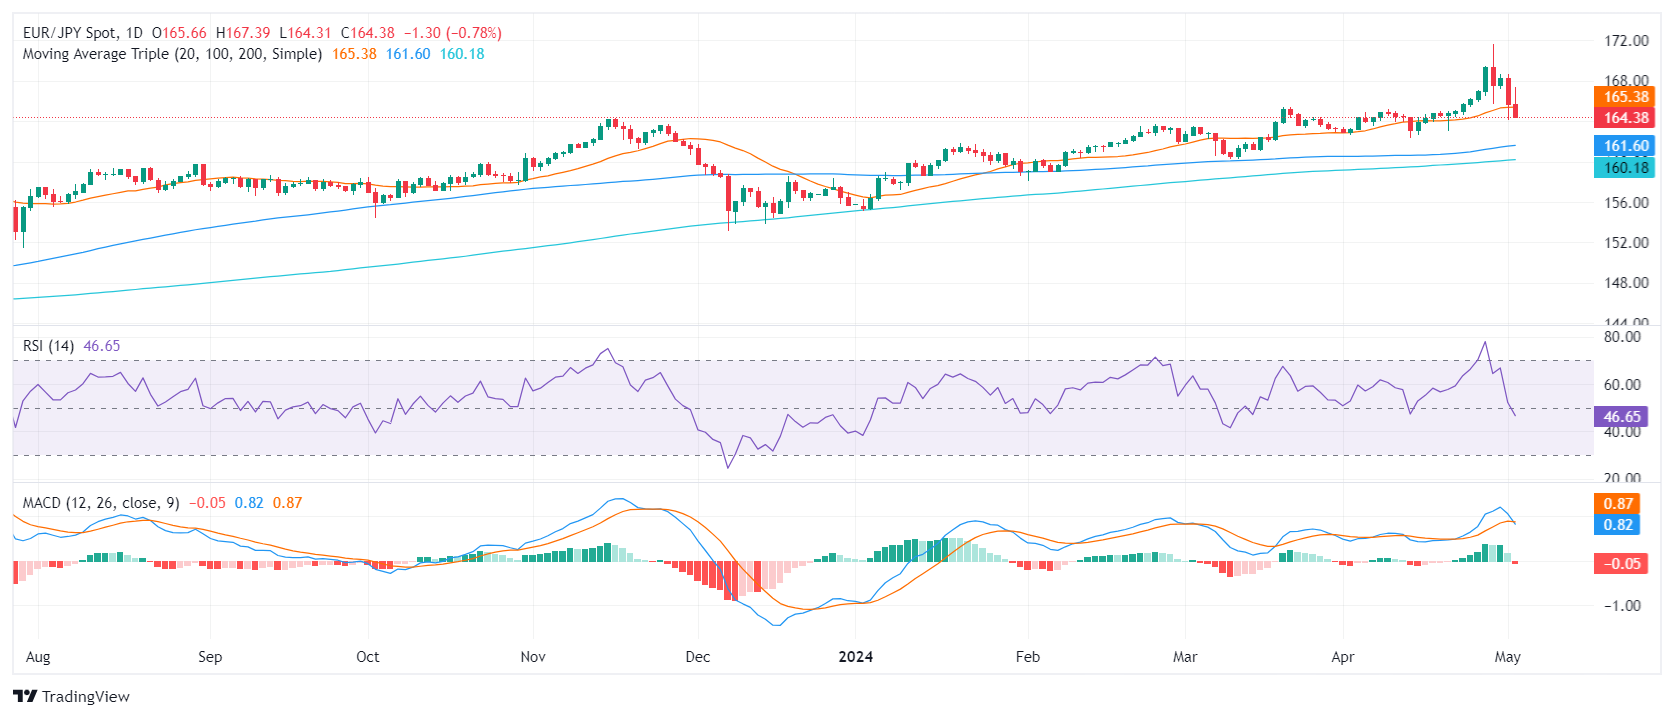
- The daily RSI for EUR/JPY highlights a decline from overbought levels to negative territory, depicting seller dominance.
- Similar to the RSI, the daily MACD shows increasing negative momentum.
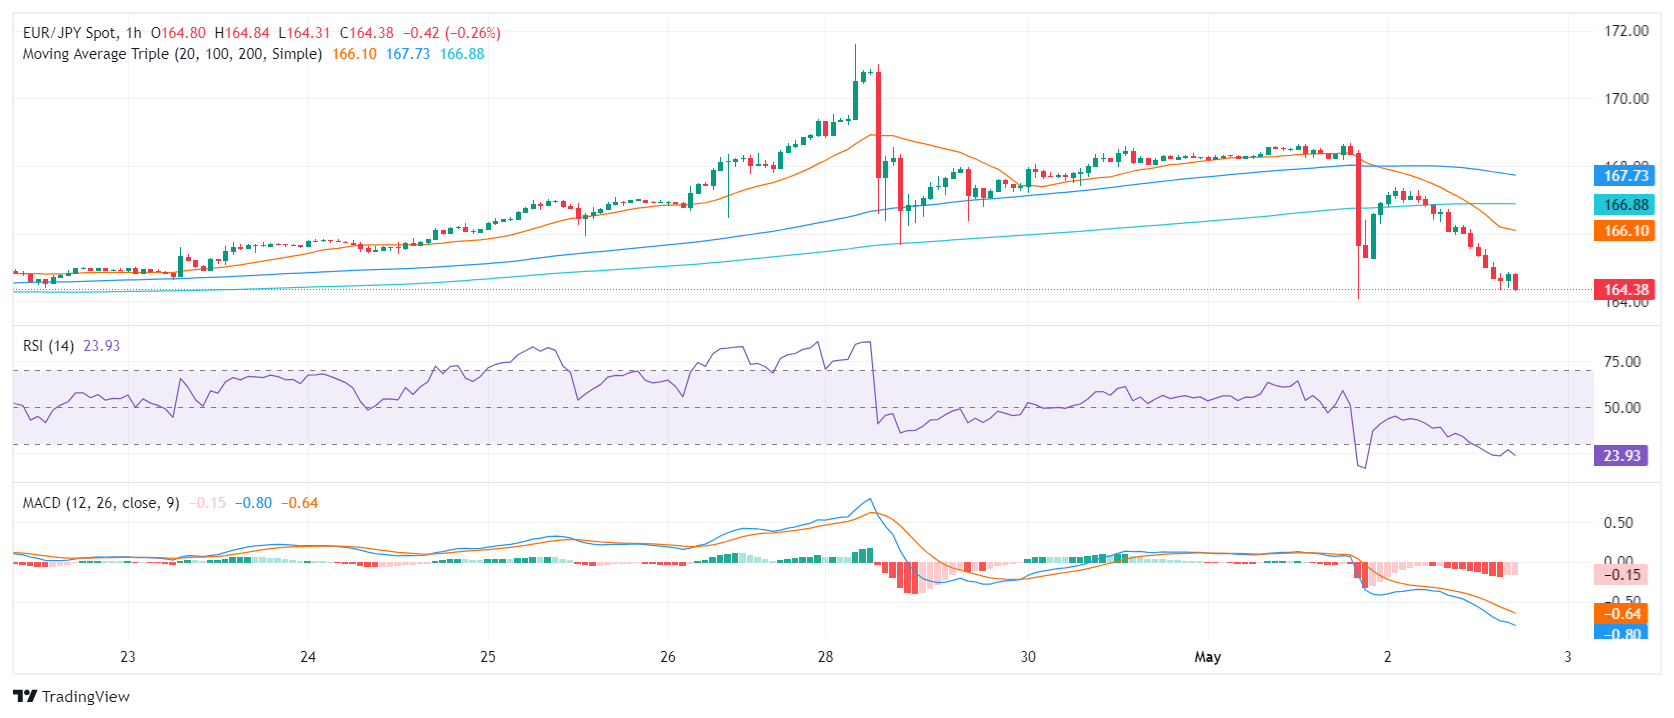
- On the hourly chart, low RSI values and a flat red MACD histogram point to a growing near-term bearishness.
The EUR/JPY pair trades at 164.65, tallying sharp losses on Thursday. Despite the increasing selling pressure, the long-term optimism remains intact, but bears are making their case as they reclaimed the 20-day Simple Moving Average (SMA) which worsened the outlook for the short term.
On the daily chart, the Relative Strength Index (RSI) for EUR/JPY has descended from the overbought readings into negative territory. The data suggests a downward momentum, indicative of a current dominant presence of sellers. At the same time, the Moving Average Convergence Divergence (MACD) histogram recorded fresh red bars which confirms a growing negative momentum.
EUR/JPY daily chart
Moving to the hourly chart, the RSI values are persistently recording low readings, venturing deep into the oversold territory. Here, the hourly MACD aligns with the daily outlook, displaying red bars which points to further negative momentum over the shorter span.
EUR/JPY hourly chart
 From a broader viewpoint, the EUR/JPY experienced a significant shift, falling below the 20-day Simple Moving Average (SMA). This suggests potential short-term bearishness but as long as the pair maintains positions above the more extended 100 and 200-day SMAs, the overall outlook will be positive.


© 2000-2026. Bản quyền Teletrade.
Trang web này được quản lý bởi Teletrade D.J. LLC 2351 LLC 2022 (Euro House, Richmond Hill Road, Kingstown, VC0100, St. Vincent and the Grenadines).
Thông tin trên trang web không phải là cơ sở để đưa ra quyết định đầu tư và chỉ được cung cấp cho mục đích làm quen.
Giao dịch trên thị trường tài chính (đặc biệt là giao dịch sử dụng các công cụ biên) mở ra những cơ hội lớn và tạo điều kiện cho các nhà đầu tư sẵn sàng mạo hiểm để thu lợi nhuận, tuy nhiên nó mang trong mình nguy cơ rủi ro khá cao. Chính vì vậy trước khi tiến hành giao dịch cần phải xem xét mọi mặt vấn đề chấp nhận tiến hành giao dịch cụ thể xét theo quan điểm của nguồn lực tài chính sẵn có và mức độ am hiểu thị trường tài chính.
Sử dụng thông tin: sử dụng toàn bộ hay riêng biệt các dữ liệu trên trang web của công ty TeleTrade như một nguồn cung cấp thông tin nhất định. Việc sử dụng tư liệu từ trang web cần kèm theo liên kết đến trang teletrade.vn. Việc tự động thu thập số liệu cũng như thông tin từ trang web TeleTrade đều không được phép.
Xin vui lòng liên hệ với pr@teletrade.global nếu có câu hỏi.
ngân hàng