- Phân tích
- Tin tức và các công cụ
- Tin tức thị trường
- NZD/USD Price Analysis: Short-term uptrend hinted, buyers might take some profits
NZD/USD Price Analysis: Short-term uptrend hinted, buyers might take some profits
- The daily RSI shows minor buying traction, further validation is needed.
- The hourly chart reveals growing buying momentum with RSI hitting overbought terrain.
- Buyers finally recovered the 20-day SMA, which brightens the outlook for the short term.
The NZD/USD rose to 0.5961, displaying a rally of 0.56% and jumping above the key short-term 20-day Simple Moving Average (SMA) on Thursday which now indicates a potential bullish bias. However, the broader trend remains bearish. With the intense increase in buying traction on an hourly scale, buyers might take some profits ahead of the Asian session.
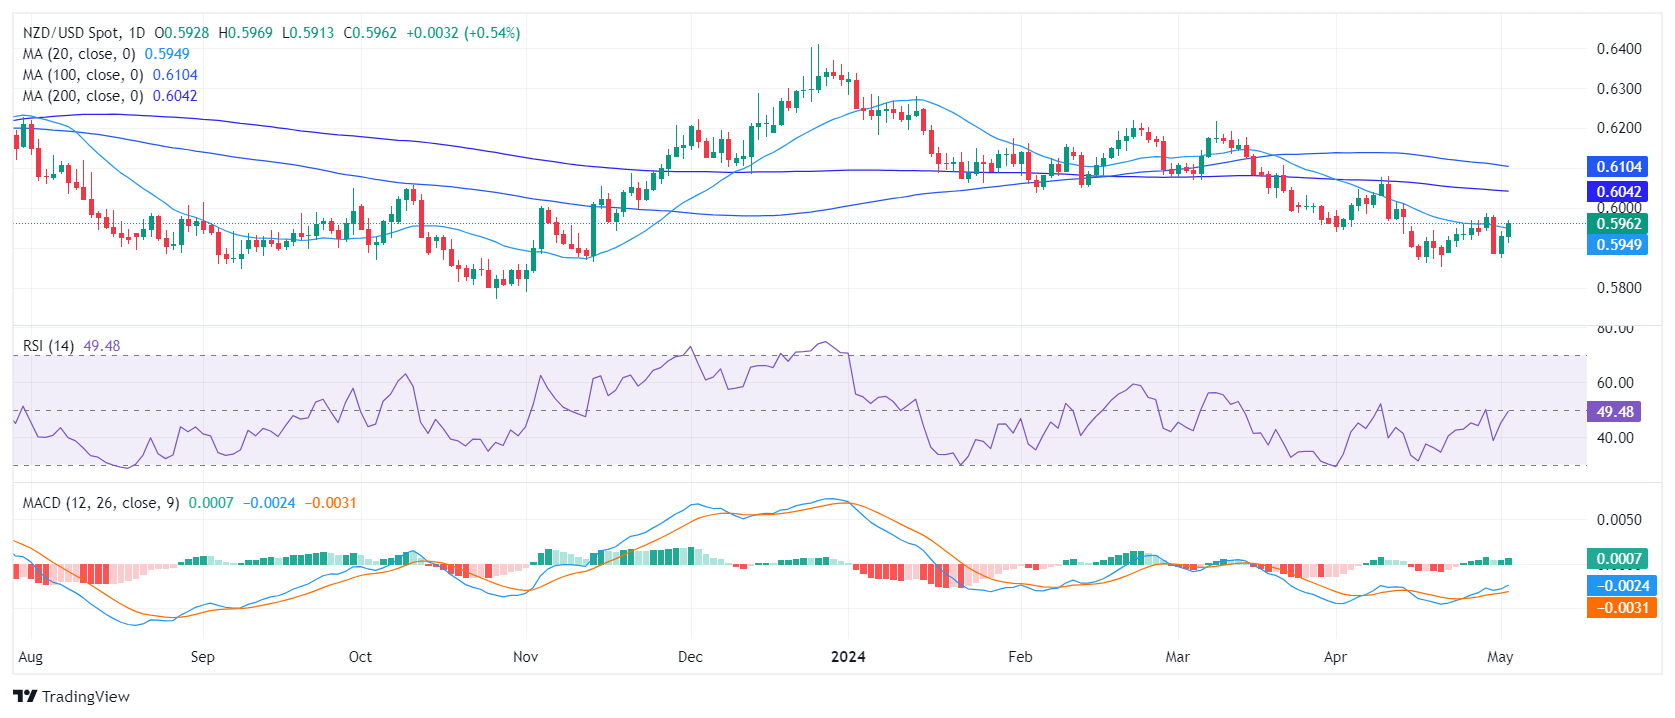
On the daily chart, the Relative Strength Index (RSI) stands just above negative territory threshold, hinting at a slight uptrend. However, this inconclusive signal requires further validation to be considered a bullish flag.
NZD/USD daily chart
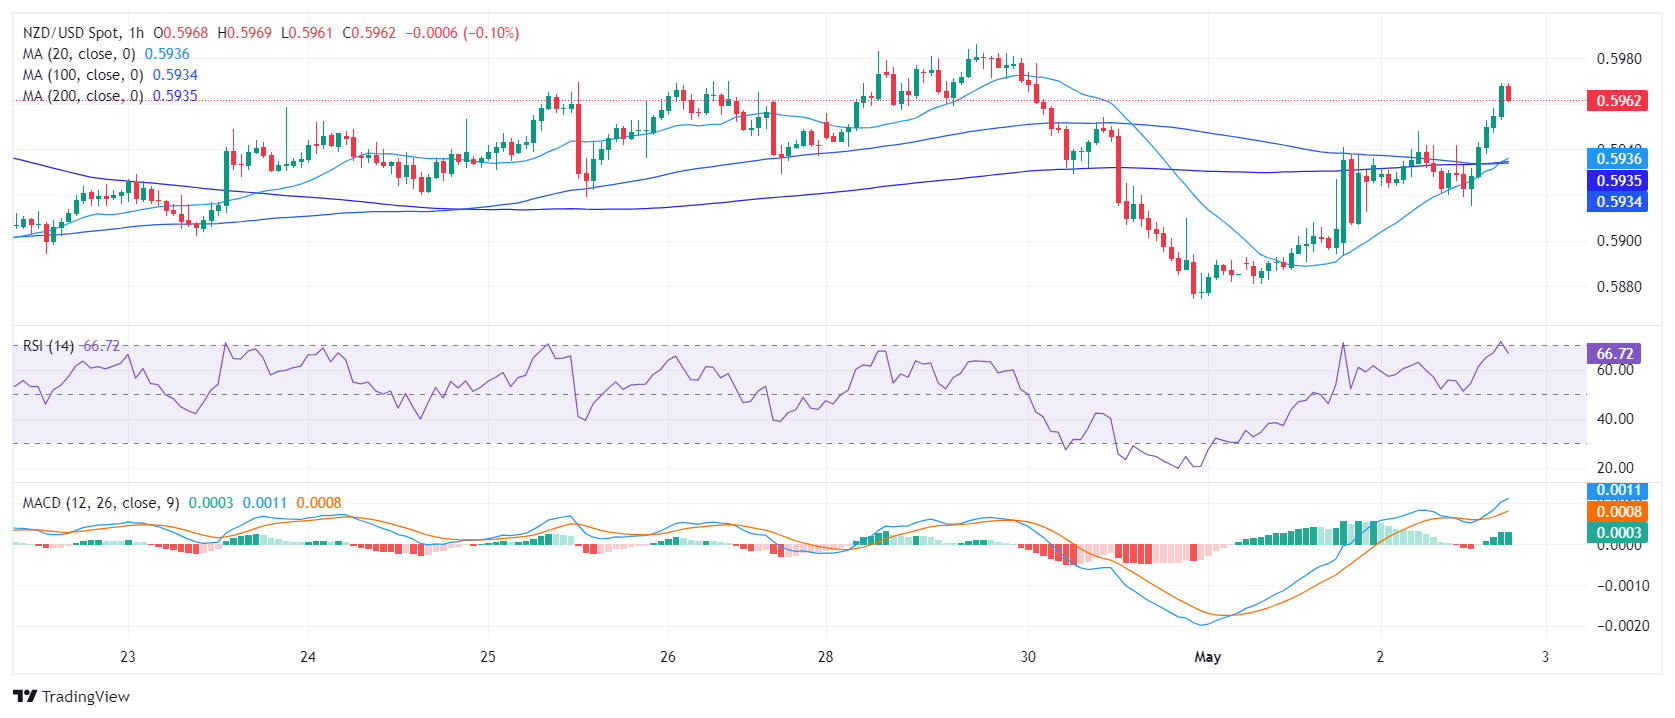
On the hourly chart, the RSI is at 66 slightly down after hitting the overbought threshold. This indicates a stronger short-term buying momentum but that the pair may start to consolidate ahead of Friday’s session. Furthermore, the Moving Average Convergence Divergence (MACD) presents green bars, showing positive momentum.
NZD/USD hourly chart
Considering broader market movements, the NZD/USD’s jump above the 20-day Simple Moving Average (SMA), signify a potential short-term upward trend. However, the pair still lingers below the 100 and 200-day SMA, implying sustained selling pressure and a bearish market bias long-term. That being said, bulls are making arguments to be considered seriously and will start to set their sight at the 100-day SMA at 0.6100.


© 2000-2026. Bản quyền Teletrade.
Trang web này được quản lý bởi Teletrade D.J. LLC 2351 LLC 2022 (Euro House, Richmond Hill Road, Kingstown, VC0100, St. Vincent and the Grenadines).
Thông tin trên trang web không phải là cơ sở để đưa ra quyết định đầu tư và chỉ được cung cấp cho mục đích làm quen.
Giao dịch trên thị trường tài chính (đặc biệt là giao dịch sử dụng các công cụ biên) mở ra những cơ hội lớn và tạo điều kiện cho các nhà đầu tư sẵn sàng mạo hiểm để thu lợi nhuận, tuy nhiên nó mang trong mình nguy cơ rủi ro khá cao. Chính vì vậy trước khi tiến hành giao dịch cần phải xem xét mọi mặt vấn đề chấp nhận tiến hành giao dịch cụ thể xét theo quan điểm của nguồn lực tài chính sẵn có và mức độ am hiểu thị trường tài chính.
Sử dụng thông tin: sử dụng toàn bộ hay riêng biệt các dữ liệu trên trang web của công ty TeleTrade như một nguồn cung cấp thông tin nhất định. Việc sử dụng tư liệu từ trang web cần kèm theo liên kết đến trang teletrade.vn. Việc tự động thu thập số liệu cũng như thông tin từ trang web TeleTrade đều không được phép.
Xin vui lòng liên hệ với pr@teletrade.global nếu có câu hỏi.
ngân hàng