- Phân tích
- Tin tức và các công cụ
- Tin tức thị trường
- EUR/JPY Price Analysis: Bearish indications dominate and sellers consolidate below the 20-day SMA
EUR/JPY Price Analysis: Bearish indications dominate and sellers consolidate below the 20-day SMA
- The daily RSI and MACD reflect a negative trend, hinting at increasing selling pressure.
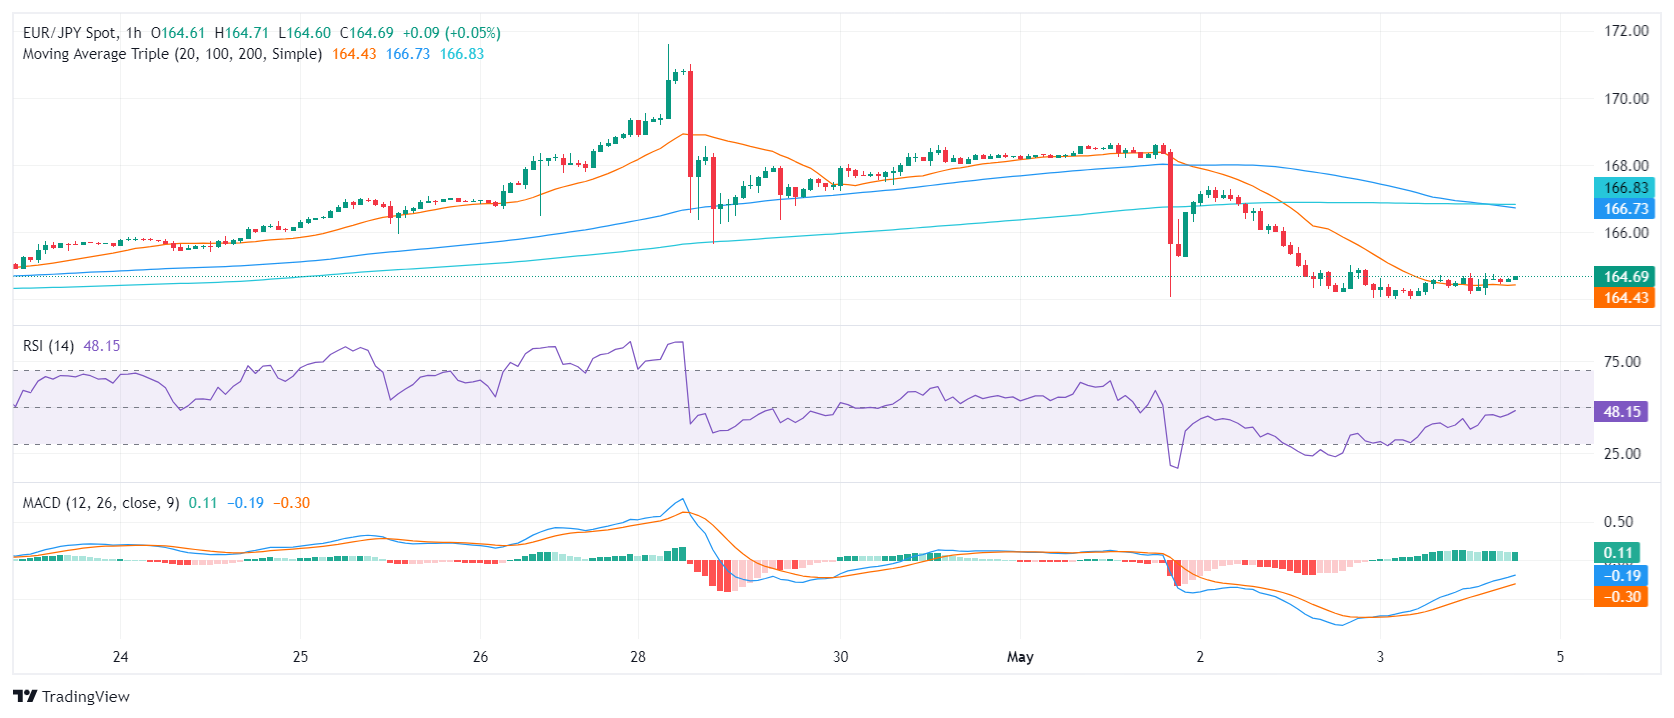
- Hourly chart indicators echo the bearish sentiment, with RSI around the 40 level and MACD showing a lack of buying momentum.
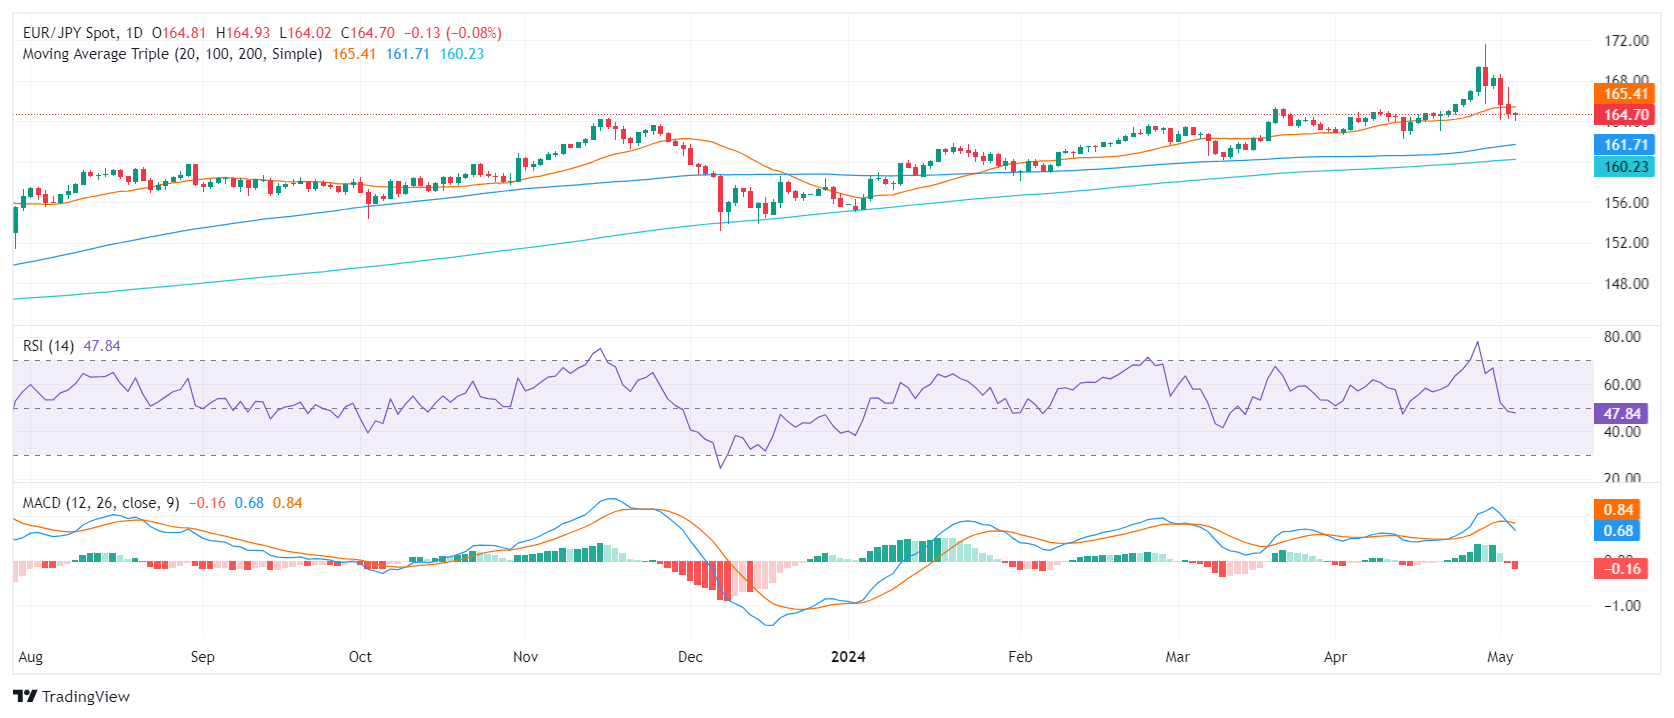
The EUR/JPY pair declined to 164.72 on Friday, reflecting subtle bears' influence with daily losses. Despite bearish signals in the daily short-term outlook, the pair's positioning above the key Simple Moving Averages (SMAs) hints at ongoing dominance by the buyers.
The daily chart reveals that the Relative Strength Index (RSI) fell into negative territory. The Moving Average Convergence Divergence (MACD) also depicts a bearish momentum with a series of rising red bars, suggesting that sellers are currently dominating the market.
EUR/JPY daily chart
On the hourly chart, RSI continues to suggest a negative trend, hovering around the 40 levels, flirting with the oversold threshold, and showcasing the dominance of the sellers. The hourly MACD shows flat green bars, indicating a lack of strong momentum in these shorter time frames.
EUR/JPY hourly chart
Considering the overall market posture, the EUR/JPY is positioned above its longer-term Simple Moving Average (SMA) of 100, and 200-day periods. This usually signals a bullish momentum in both the medium and long term. However, the fall of the 20-day SMA means that the short-term outlook is painted with bearishness, and bears might attempt to reclaim the 100-day SMA at 161.70, which would definitely worsen the technical outlook in case of conquering.


© 2000-2026. Bản quyền Teletrade.
Trang web này được quản lý bởi Teletrade D.J. LLC 2351 LLC 2022 (Euro House, Richmond Hill Road, Kingstown, VC0100, St. Vincent and the Grenadines).
Thông tin trên trang web không phải là cơ sở để đưa ra quyết định đầu tư và chỉ được cung cấp cho mục đích làm quen.
Giao dịch trên thị trường tài chính (đặc biệt là giao dịch sử dụng các công cụ biên) mở ra những cơ hội lớn và tạo điều kiện cho các nhà đầu tư sẵn sàng mạo hiểm để thu lợi nhuận, tuy nhiên nó mang trong mình nguy cơ rủi ro khá cao. Chính vì vậy trước khi tiến hành giao dịch cần phải xem xét mọi mặt vấn đề chấp nhận tiến hành giao dịch cụ thể xét theo quan điểm của nguồn lực tài chính sẵn có và mức độ am hiểu thị trường tài chính.
Sử dụng thông tin: sử dụng toàn bộ hay riêng biệt các dữ liệu trên trang web của công ty TeleTrade như một nguồn cung cấp thông tin nhất định. Việc sử dụng tư liệu từ trang web cần kèm theo liên kết đến trang teletrade.vn. Việc tự động thu thập số liệu cũng như thông tin từ trang web TeleTrade đều không được phép.
Xin vui lòng liên hệ với pr@teletrade.global nếu có câu hỏi.
ngân hàng