- Phân tích
- Tin tức và các công cụ
- Tin tức thị trường
- USD/JPY Price Analysis: Bears charge helped by intervention rumors, eye 152.00
USD/JPY Price Analysis: Bears charge helped by intervention rumors, eye 152.00
- USD/JPY drops 0.49%, extending a downtrend possibly sparked by earlier BoJ intervention.
- Bearish harami pattern observed; recovery contingent on breaking 153.00 resistance.
- Key support at 152.00; further declines may target April's low of 150.81.
The USD/JPY dropped for the third straight day and accumulated losses of more than 3.40% in the week after a suspected intervention by the Bank of Japan (BoJ) on Monday. Since then, the pair formed a two-candlestick chart pattern, a ‘bearish harami’ which reassembles an inside day, confirmed by Wednesday’s price action. That said, on Friday, the pair fell 0.49% and traded at 152.93.
USD/JPY Price Analysis: Technical outlook
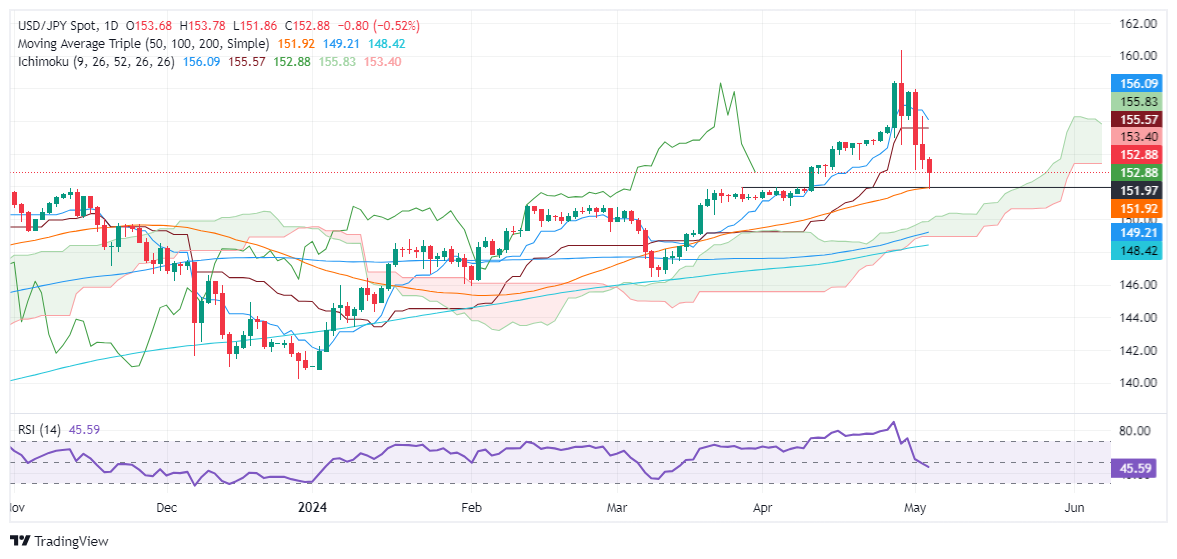
Despite retreating sharply during the week, the USD/JPY is still upward biased, as shown by the daily chart. The pair registered a daily low at the confluence of October 21, 2022, low and the 50-day moving average at around 151.87/92, but buyers lifted the pair toward current exchange rates.
If buyers push prices above 153.00 and achieve a daily close above the latter, that could pave the way for further gains. The first resistance would be the Senkou Span B at 153.35, followed by the 154.00 figure. Further gains are seen once those levels are surpassed, with the next resistance seen at the confluence of the Senkou Span A and the Kijun-Sen at 155.78.
On the other hand, the first support would be the 152.00 mark, followed by the previously mentioned confluence of the 50-DMA and October’s 2022 high at 151.92/87. A breach of that level would cause the pair to dive toward April’s 5 low at 150.81.
USD/JPY Price Action – Daily Chart


© 2000-2026. Bản quyền Teletrade.
Trang web này được quản lý bởi Teletrade D.J. LLC 2351 LLC 2022 (Euro House, Richmond Hill Road, Kingstown, VC0100, St. Vincent and the Grenadines).
Thông tin trên trang web không phải là cơ sở để đưa ra quyết định đầu tư và chỉ được cung cấp cho mục đích làm quen.
Giao dịch trên thị trường tài chính (đặc biệt là giao dịch sử dụng các công cụ biên) mở ra những cơ hội lớn và tạo điều kiện cho các nhà đầu tư sẵn sàng mạo hiểm để thu lợi nhuận, tuy nhiên nó mang trong mình nguy cơ rủi ro khá cao. Chính vì vậy trước khi tiến hành giao dịch cần phải xem xét mọi mặt vấn đề chấp nhận tiến hành giao dịch cụ thể xét theo quan điểm của nguồn lực tài chính sẵn có và mức độ am hiểu thị trường tài chính.
Sử dụng thông tin: sử dụng toàn bộ hay riêng biệt các dữ liệu trên trang web của công ty TeleTrade như một nguồn cung cấp thông tin nhất định. Việc sử dụng tư liệu từ trang web cần kèm theo liên kết đến trang teletrade.vn. Việc tự động thu thập số liệu cũng như thông tin từ trang web TeleTrade đều không được phép.
Xin vui lòng liên hệ với pr@teletrade.global nếu có câu hỏi.
ngân hàng