- Phân tích
- Tin tức và các công cụ
- Tin tức thị trường
- NZD/USD Price Analysis: Bullish momentum picks up, buyers rejected at the 100-day SMA
NZD/USD Price Analysis: Bullish momentum picks up, buyers rejected at the 100-day SMA
- The daily indicators hint at a strengthening bullish momentum.
- Hourly indicators are consolidating after hitting overbought conditions earlier in the session.
- If the buyers regain the 100-day SMA, the bearish trend will be threatened.
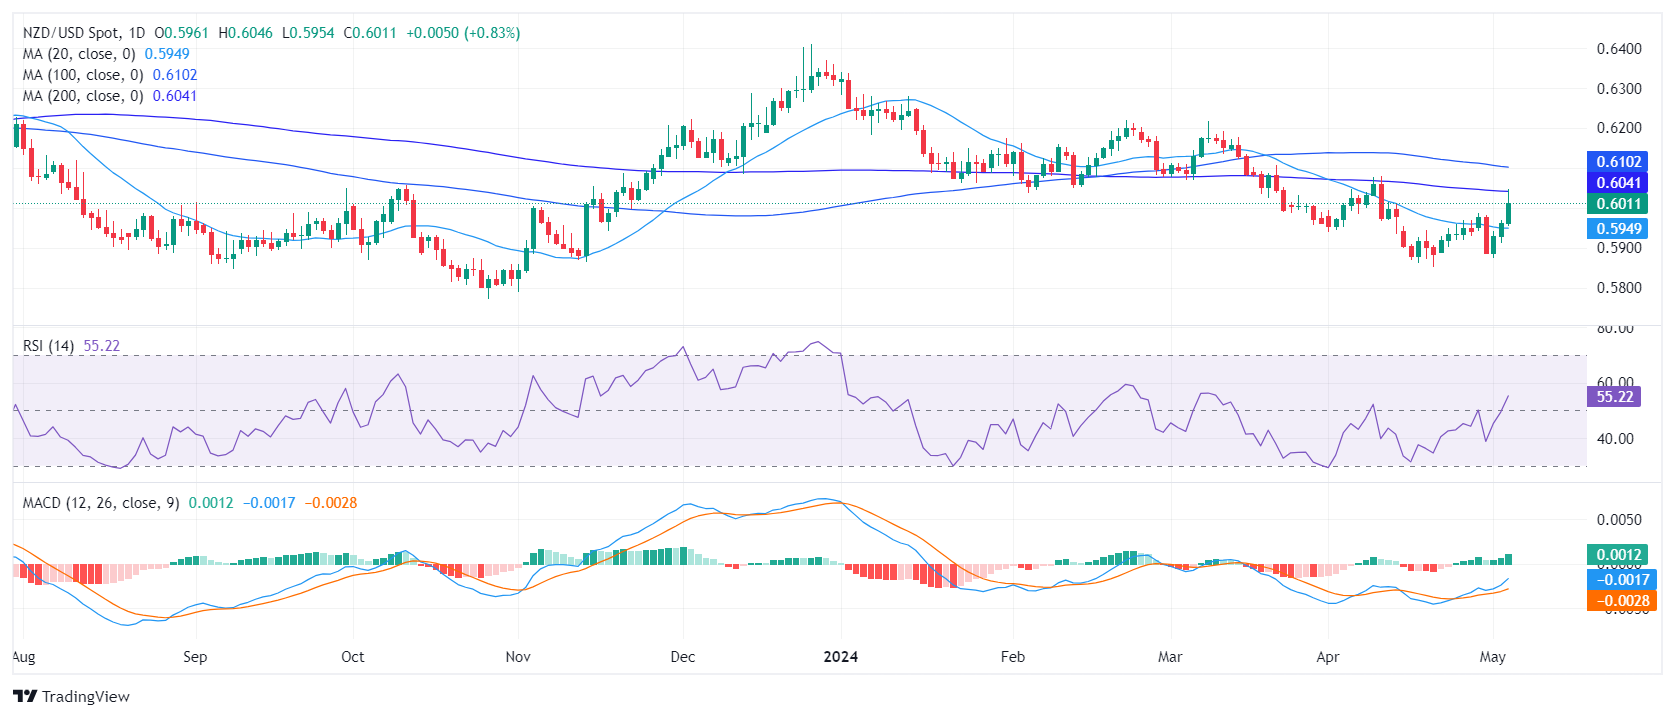
At the end of the week, the NZD/USD rallied to around 0.6050, up by 0.80%. Bullish momentum is picking up but the overall trend is still tilted in favor of the sellers. Further bullish validation is needed after the pair's unsuccessful attempt to cross a crucial 100-day Simple Moving Average (SMA) during Friday's session.
On the daily chart, the Relative Strength Index (RSI) shows a shift towards a stronger bullish trend. The last session recorded an RSI of 56, settling in positive territory. This solidifies a consistent increase in momentum in favor of buyers after being below 50 since early April.
NZD/USD daily chart
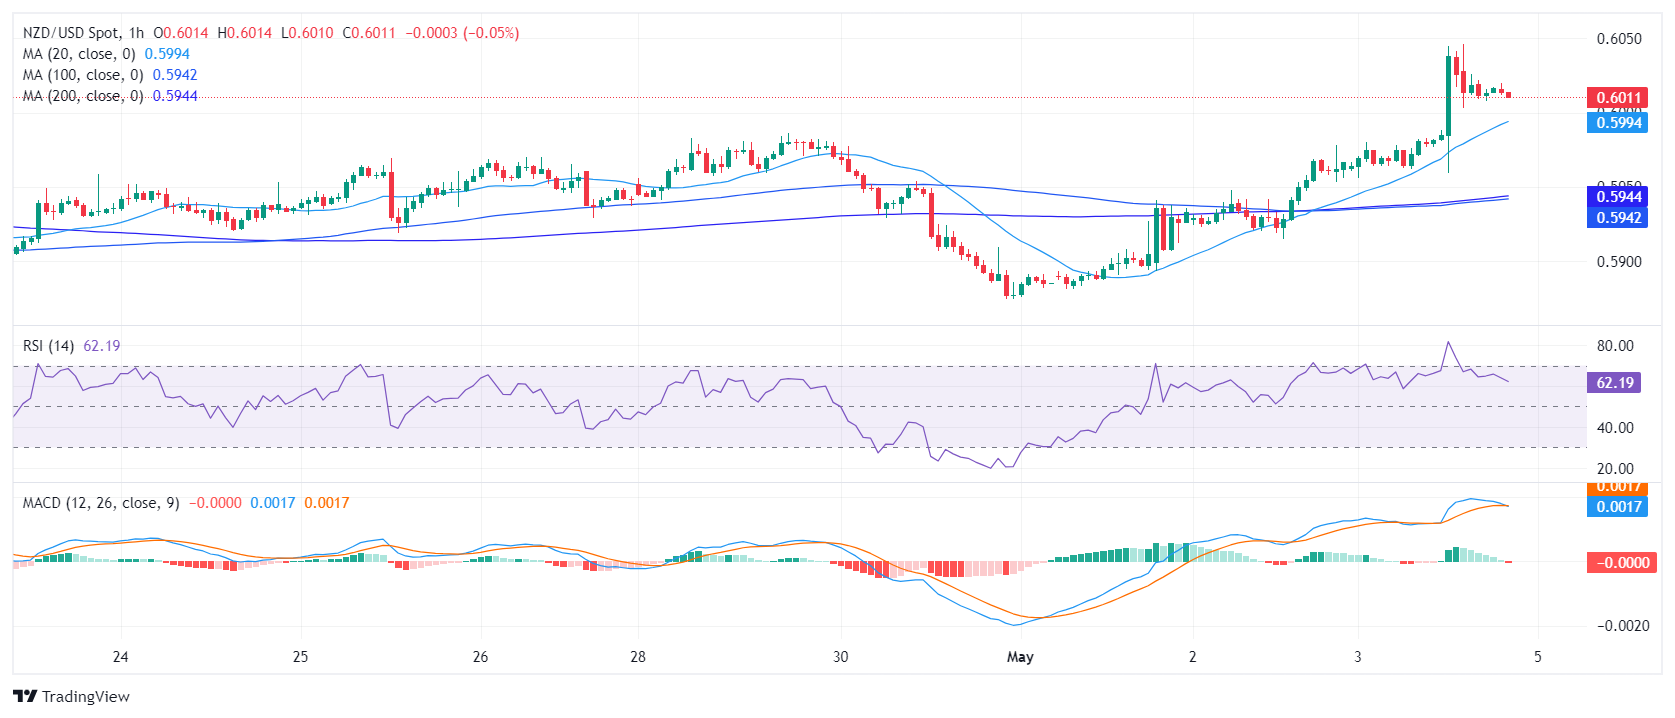
Examining the hourly chart, a similar viewpoint is observed. The RSI measures 62, but somewhat flattened after jumping above 70 earlier in the session. In addition, the Moving Average Convergence Divergence (MACD) histogram exhibited consistent red bars, signaling a potential deceleration in the bullish momentum.
NZD/USD hourly chart
Regarding the overall market trend, the NZD/USD is trading below the 100, and 200-day SMA which confirms the presence of significant downside pressure on the pair and challenges short-term buyers. Notably, the pair encountered rejection around the 100-day SMA at the 0.6100 level during Friday’s session, suggesting the buyers still need more traction to turn the outlook bullish. However, the break above the 20-day SMA definitely brightened the outlook for the short term.


© 2000-2026. Bản quyền Teletrade.
Trang web này được quản lý bởi Teletrade D.J. LLC 2351 LLC 2022 (Euro House, Richmond Hill Road, Kingstown, VC0100, St. Vincent and the Grenadines).
Thông tin trên trang web không phải là cơ sở để đưa ra quyết định đầu tư và chỉ được cung cấp cho mục đích làm quen.
Giao dịch trên thị trường tài chính (đặc biệt là giao dịch sử dụng các công cụ biên) mở ra những cơ hội lớn và tạo điều kiện cho các nhà đầu tư sẵn sàng mạo hiểm để thu lợi nhuận, tuy nhiên nó mang trong mình nguy cơ rủi ro khá cao. Chính vì vậy trước khi tiến hành giao dịch cần phải xem xét mọi mặt vấn đề chấp nhận tiến hành giao dịch cụ thể xét theo quan điểm của nguồn lực tài chính sẵn có và mức độ am hiểu thị trường tài chính.
Sử dụng thông tin: sử dụng toàn bộ hay riêng biệt các dữ liệu trên trang web của công ty TeleTrade như một nguồn cung cấp thông tin nhất định. Việc sử dụng tư liệu từ trang web cần kèm theo liên kết đến trang teletrade.vn. Việc tự động thu thập số liệu cũng như thông tin từ trang web TeleTrade đều không được phép.
Xin vui lòng liên hệ với pr@teletrade.global nếu có câu hỏi.
ngân hàng