- Phân tích
- Tin tức và các công cụ
- Tin tức thị trường
- EUR/GBP Price Analysis: Continues oscillating within a range – currently falling
EUR/GBP Price Analysis: Continues oscillating within a range – currently falling
- EUR/GBP price has just reversed lower after rising up to near the range highs.
- The sideways trend is likely to extend, with price oscillating within the range.
- EUR/GBP is currently finding support from a cluster of major Moving Averages in the 0.8560s.
EUR/GBP price is trading in the 0.8560s, in the middle of a multi-month range on Monday. It moved lower after rising up to close to the range ceiling.
The pair is in a sideways trend which is expected to extend given the old traders adage that “the trend is your friend”.
EUR/GBP 4-hour Chart
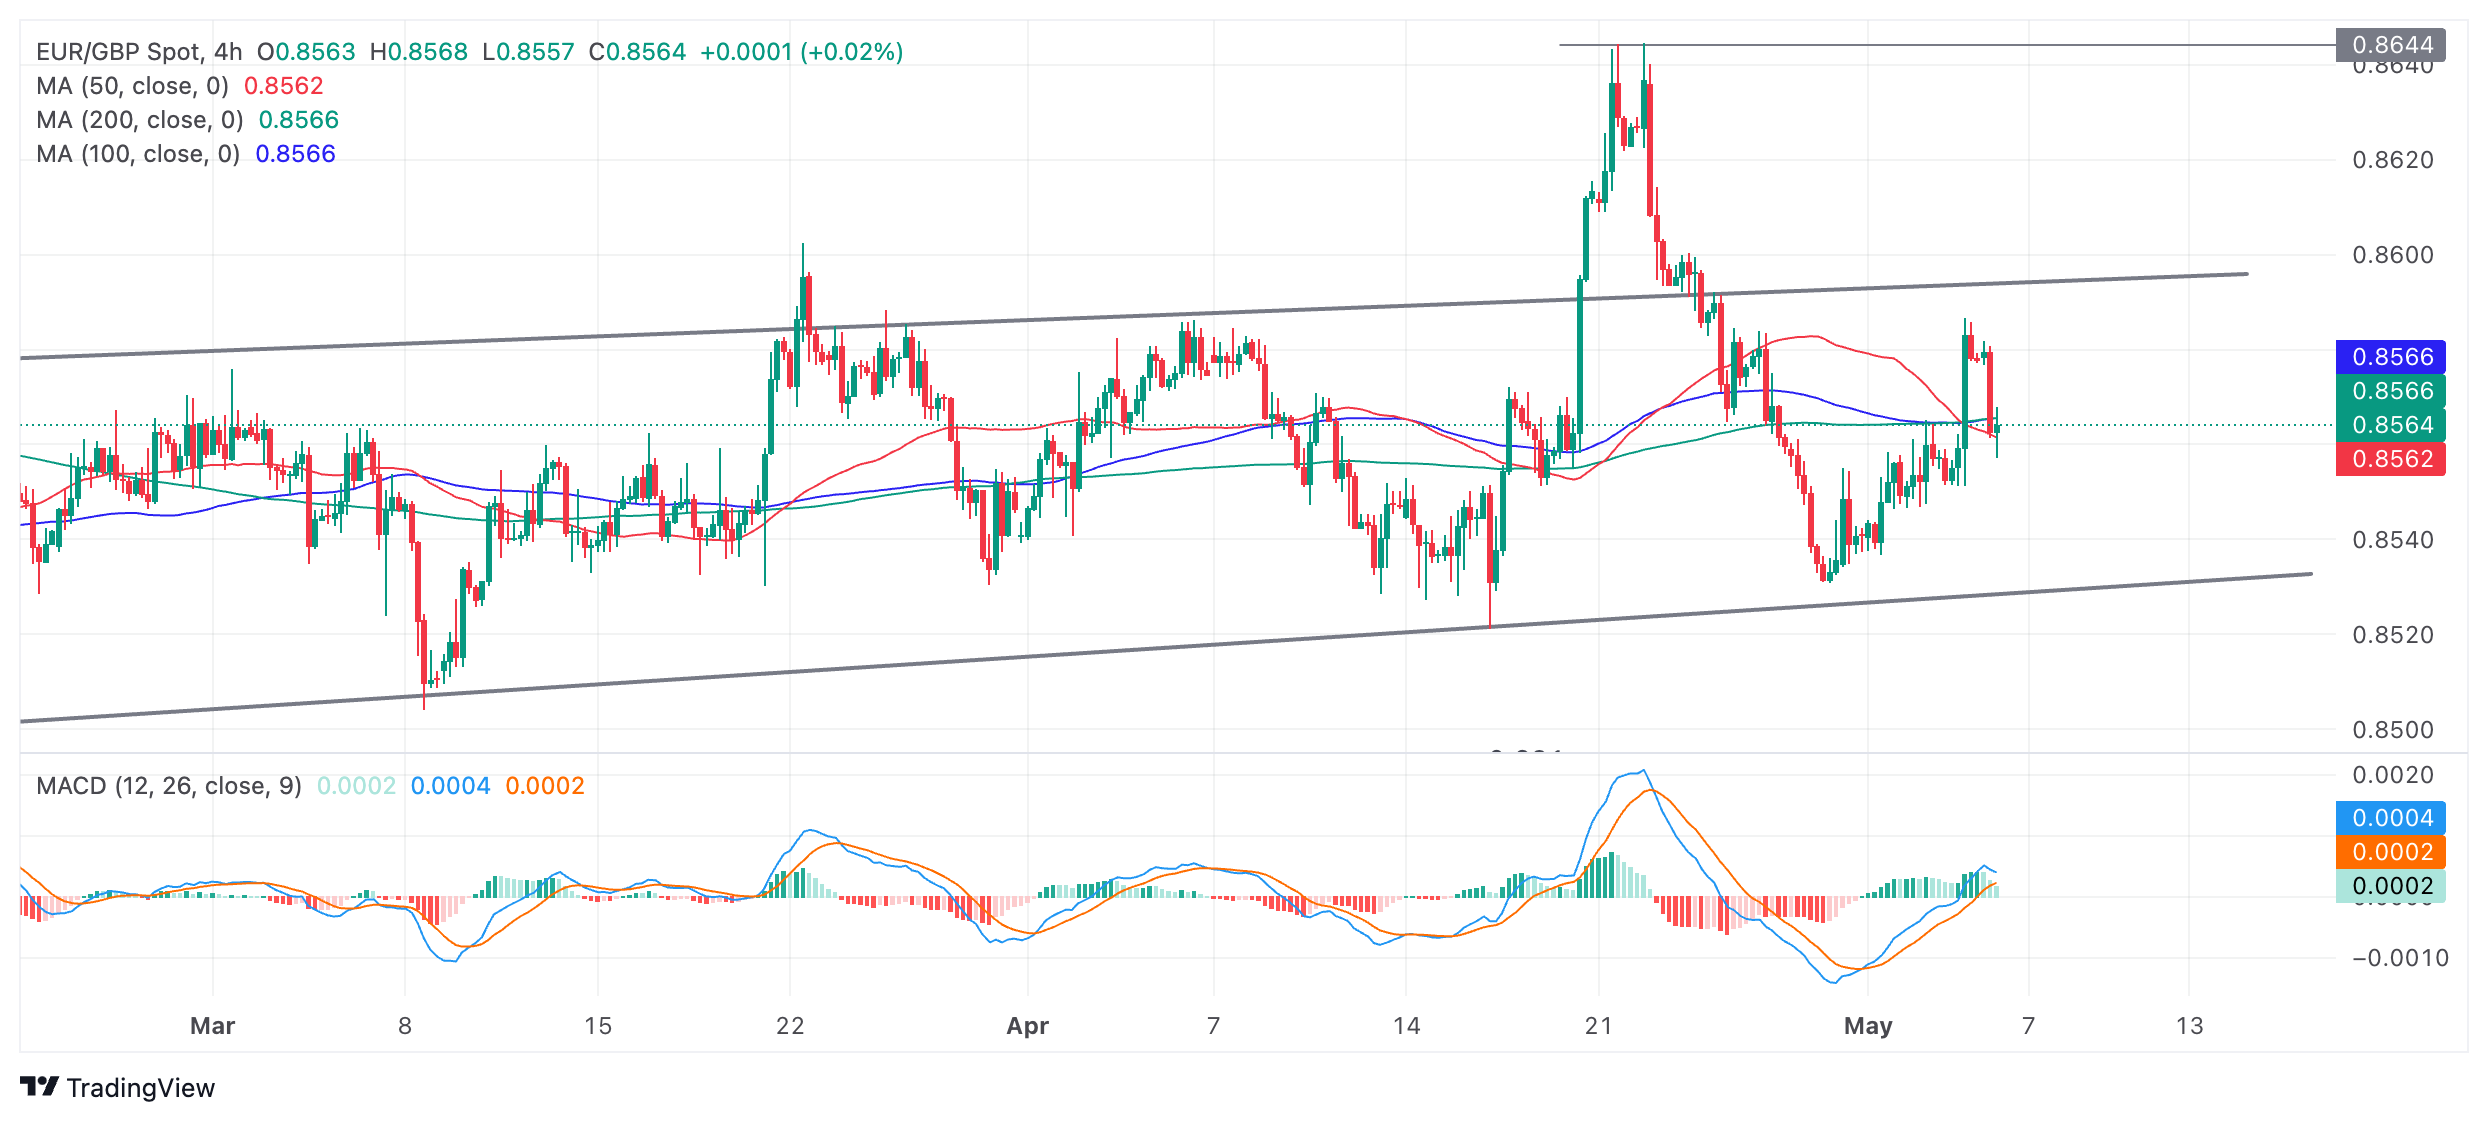
After rising up and almost touching the top of the range on Friday, EUR/GBP reversed and has fallen to a cluster of MAs at 0.8565, where it has temporarily found support. If the pair can decisively break below this cluster of MAs which is made up of the 50, 100 and 200 Simple Moving Averages (SMA) it will probably fall back down to support at 0.8530.
The Moving Average Convergence Divergence (MACD) indicator has moved above the zero line, a bullish sign, however it is turning lower. If it crosses below the red signal line it will give a sell signal and suggest more downside for XAG/USD. The signal would be enhanced by the fact the pair was in a sideways trend and MACD is proven to be a more reliable indicator in non-trending markets.
Change in trend?
For a change of the sideways trend to be confirmed Silver price would need to make a decisive break above or below the range.
In the case of a break below the range floor such a move would open the way for more downside to the next target at 0.8486 – the 0.681 Fibonacci ratio of the height of the range extrapolated lower from the channel’s base. This is the method used by technical analysts to estimate range breakouts. Further weakness could even see price reach the next target at 0.8460, the full height of the range extrapolated lower (1.000).
Likewise a decisive break above the range high at 0.8595 would signal a breakout with an initial target at 0.8635 followed by the 0.8645 highs.
A decisive break would be one characterized by a long candlestick that broke completely above or below the range floor and closed near its high or low, or three consecutive red candlesticks that broke clearly through the level.


© 2000-2026. Bản quyền Teletrade.
Trang web này được quản lý bởi Teletrade D.J. LLC 2351 LLC 2022 (Euro House, Richmond Hill Road, Kingstown, VC0100, St. Vincent and the Grenadines).
Thông tin trên trang web không phải là cơ sở để đưa ra quyết định đầu tư và chỉ được cung cấp cho mục đích làm quen.
Giao dịch trên thị trường tài chính (đặc biệt là giao dịch sử dụng các công cụ biên) mở ra những cơ hội lớn và tạo điều kiện cho các nhà đầu tư sẵn sàng mạo hiểm để thu lợi nhuận, tuy nhiên nó mang trong mình nguy cơ rủi ro khá cao. Chính vì vậy trước khi tiến hành giao dịch cần phải xem xét mọi mặt vấn đề chấp nhận tiến hành giao dịch cụ thể xét theo quan điểm của nguồn lực tài chính sẵn có và mức độ am hiểu thị trường tài chính.
Sử dụng thông tin: sử dụng toàn bộ hay riêng biệt các dữ liệu trên trang web của công ty TeleTrade như một nguồn cung cấp thông tin nhất định. Việc sử dụng tư liệu từ trang web cần kèm theo liên kết đến trang teletrade.vn. Việc tự động thu thập số liệu cũng như thông tin từ trang web TeleTrade đều không được phép.
Xin vui lòng liên hệ với pr@teletrade.global nếu có câu hỏi.
ngân hàng