- Phân tích
- Tin tức và các công cụ
- Tin tức thị trường
- NZD/USD Price Analysis: Bullish swing in motion, bearish upturn still possible
NZD/USD Price Analysis: Bullish swing in motion, bearish upturn still possible
- The daily RSI and MACD show a growing bullish momentum.
- The hourly chart RSI reveals a possible slowdown in growing buying traction.
- The NZD/USD still lags behind other main SMAs, potentially pointing to a long-term bearish prospect.
The NZD/USD pair is seen exhibiting a minor decline, dropping towards the 0.6000 level in Monday's session. The market pattern appears to be dominated by a bullish swing, suggesting an increase in buyer control. Despite this, the possibility of bearish movements remains, as the key Simple Moving Averages (SMAs) and shifting investor sentiment indicate that the bulls need further validation.
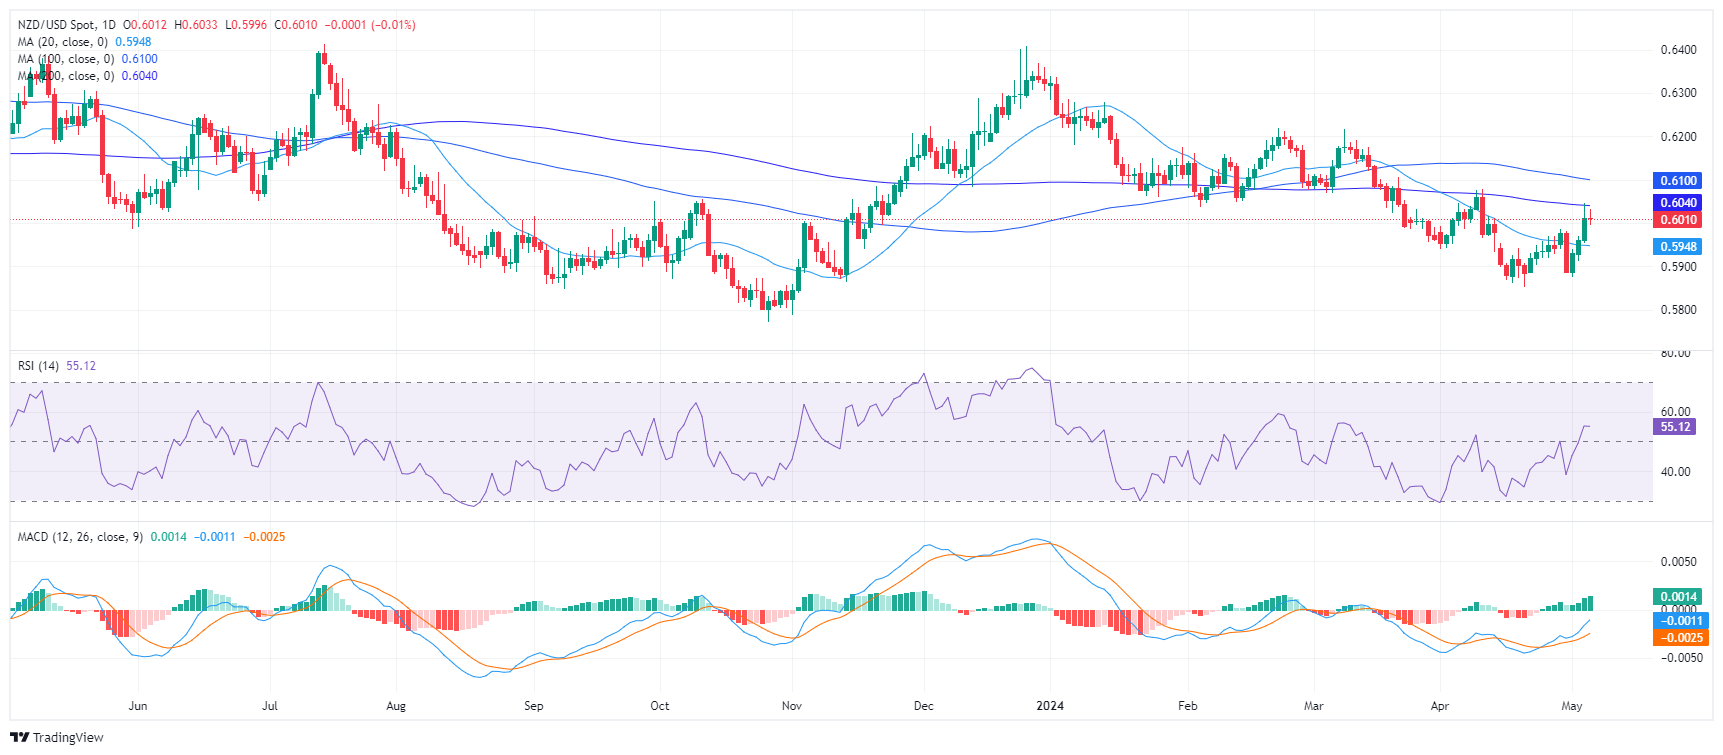
On the daily chart, the Relative Strength Index (RSI) points toward the positive territory, signaling that buyers are beginning to gain control. The gradual shift to 56 from a low of 38 indicates dominant bullish momentum. The Moving Average Convergence Divergence (MACD) further confirms this bullish sentiment with its rising green bars which denote positive momentum.
NZD/USD daily chart
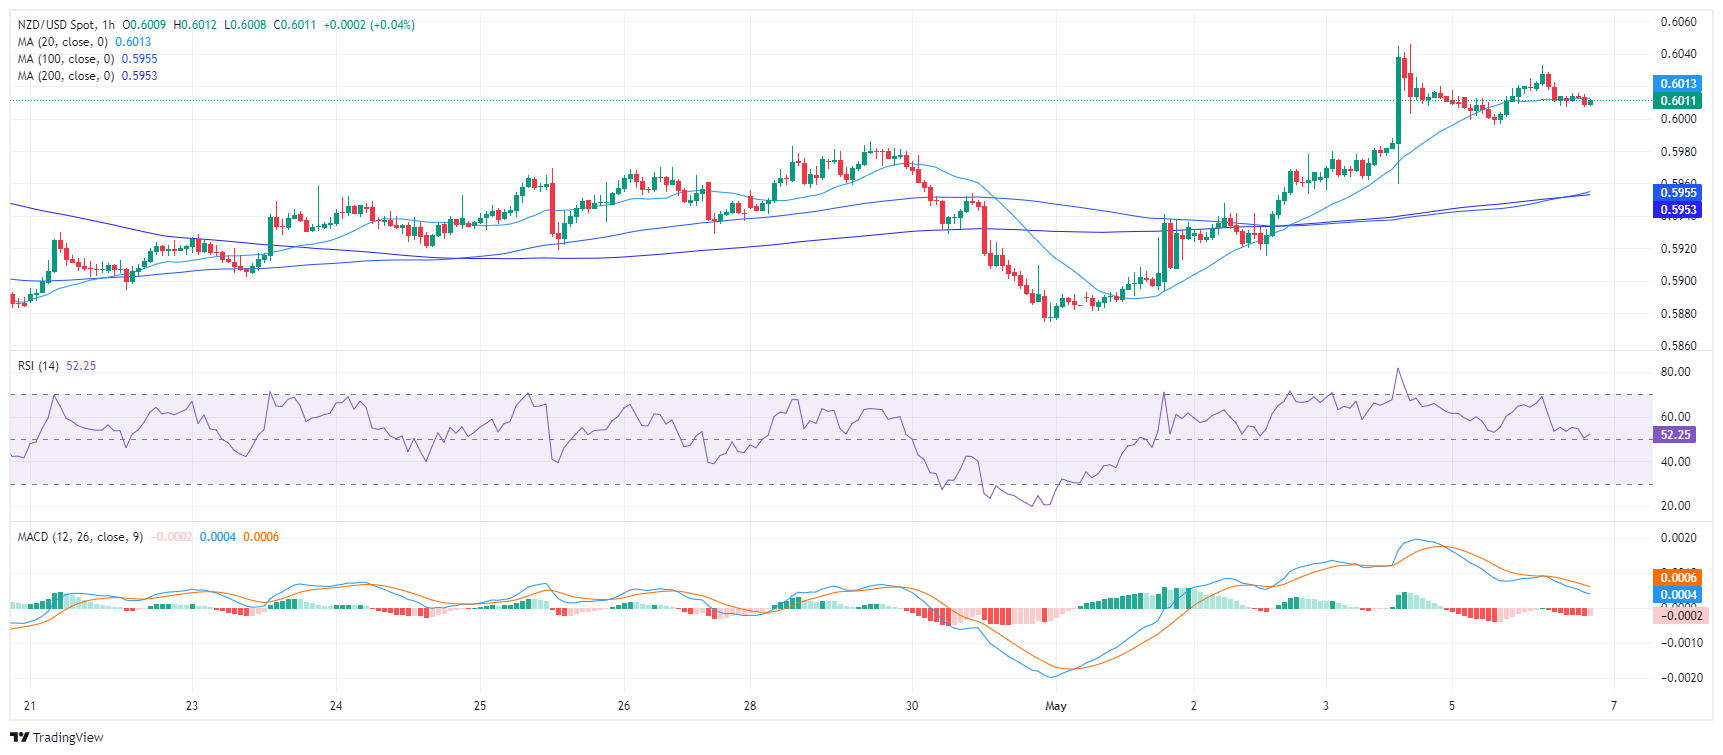
While assessing the hourly chart, the RSI depicts moderate fluctuations within the positive region. The most recent reading stands at 51, slightly below its daily counterpart, which could hint at a mild slowdown in buyer momentum. The view is affirmed by the MACD histogram that displays flat red bars, indicating a reduction in positive momentum.
NZD/USD hourly chart
When considering the broader outlook, the NZD/USD position concerning its Simple Moving Averages (SMA) reveals a short-term bullish outset against a potentially long-term bearish trajectory. However, a noted drawback in buyers at the 100-day SMA underscores a potential bearish trend that traders should closely monitor.


© 2000-2026. Bản quyền Teletrade.
Trang web này được quản lý bởi Teletrade D.J. LLC 2351 LLC 2022 (Euro House, Richmond Hill Road, Kingstown, VC0100, St. Vincent and the Grenadines).
Thông tin trên trang web không phải là cơ sở để đưa ra quyết định đầu tư và chỉ được cung cấp cho mục đích làm quen.
Giao dịch trên thị trường tài chính (đặc biệt là giao dịch sử dụng các công cụ biên) mở ra những cơ hội lớn và tạo điều kiện cho các nhà đầu tư sẵn sàng mạo hiểm để thu lợi nhuận, tuy nhiên nó mang trong mình nguy cơ rủi ro khá cao. Chính vì vậy trước khi tiến hành giao dịch cần phải xem xét mọi mặt vấn đề chấp nhận tiến hành giao dịch cụ thể xét theo quan điểm của nguồn lực tài chính sẵn có và mức độ am hiểu thị trường tài chính.
Sử dụng thông tin: sử dụng toàn bộ hay riêng biệt các dữ liệu trên trang web của công ty TeleTrade như một nguồn cung cấp thông tin nhất định. Việc sử dụng tư liệu từ trang web cần kèm theo liên kết đến trang teletrade.vn. Việc tự động thu thập số liệu cũng như thông tin từ trang web TeleTrade đều không được phép.
Xin vui lòng liên hệ với pr@teletrade.global nếu có câu hỏi.
ngân hàng