- Phân tích
- Tin tức và các công cụ
- Tin tức thị trường
- EUR/JPY Price Analysis: Bears lose ground and bulls reclaim the 20-day SMA
EUR/JPY Price Analysis: Bears lose ground and bulls reclaim the 20-day SMA
- Despite the red flag hinted by the negative territory of the daily MACD, the buying momentum continues to strengthen.
- The hourly RSI and MACD reveal a consolidation phase in the market, indicating a temporary balance between buyers and sellers.
- The short-term outlook now favors the bulls as sellers failed to consolidate below the 20-day SMA.
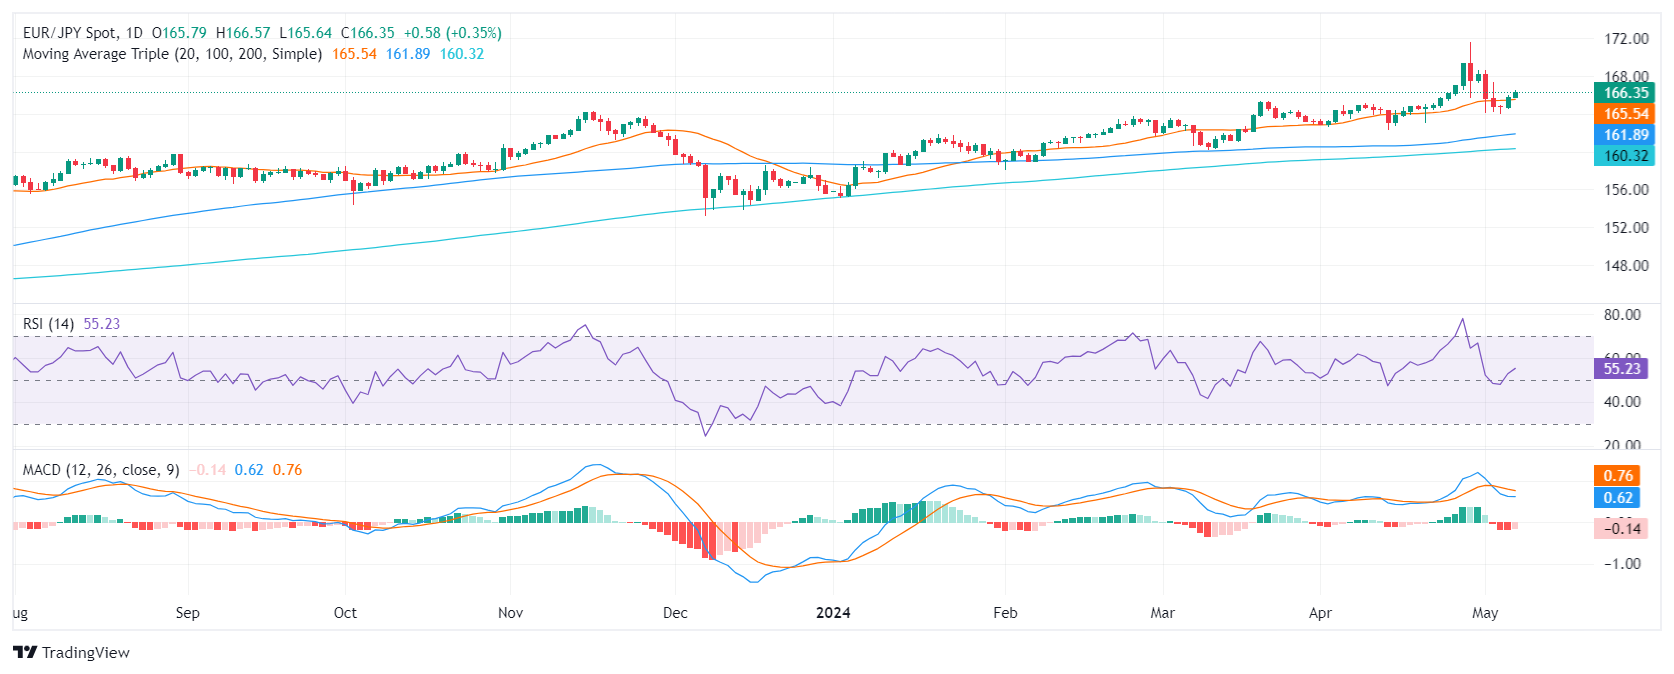
On Tuesday, the EURJPY rose by 0.36% to 166.35, and successfully secured a position above the key 20-day Simple Moving Average (SMA), alluding to the prevailing power of the bulls in the current market. Indicators on the daily chart improved while buyers seem to be consolidating gains on the hourly chart..
On the daily chart, the Relative Strength Index (RSI) for EUR/JPY displays a positive trend. The RSI's recovery from below 50 to 59, is forming a mildly bullish picture. In addition, the Moving Average Convergence Divergence (MACD) shows a weak selling traction, with falling red bars.
EUR/JPY daily chart
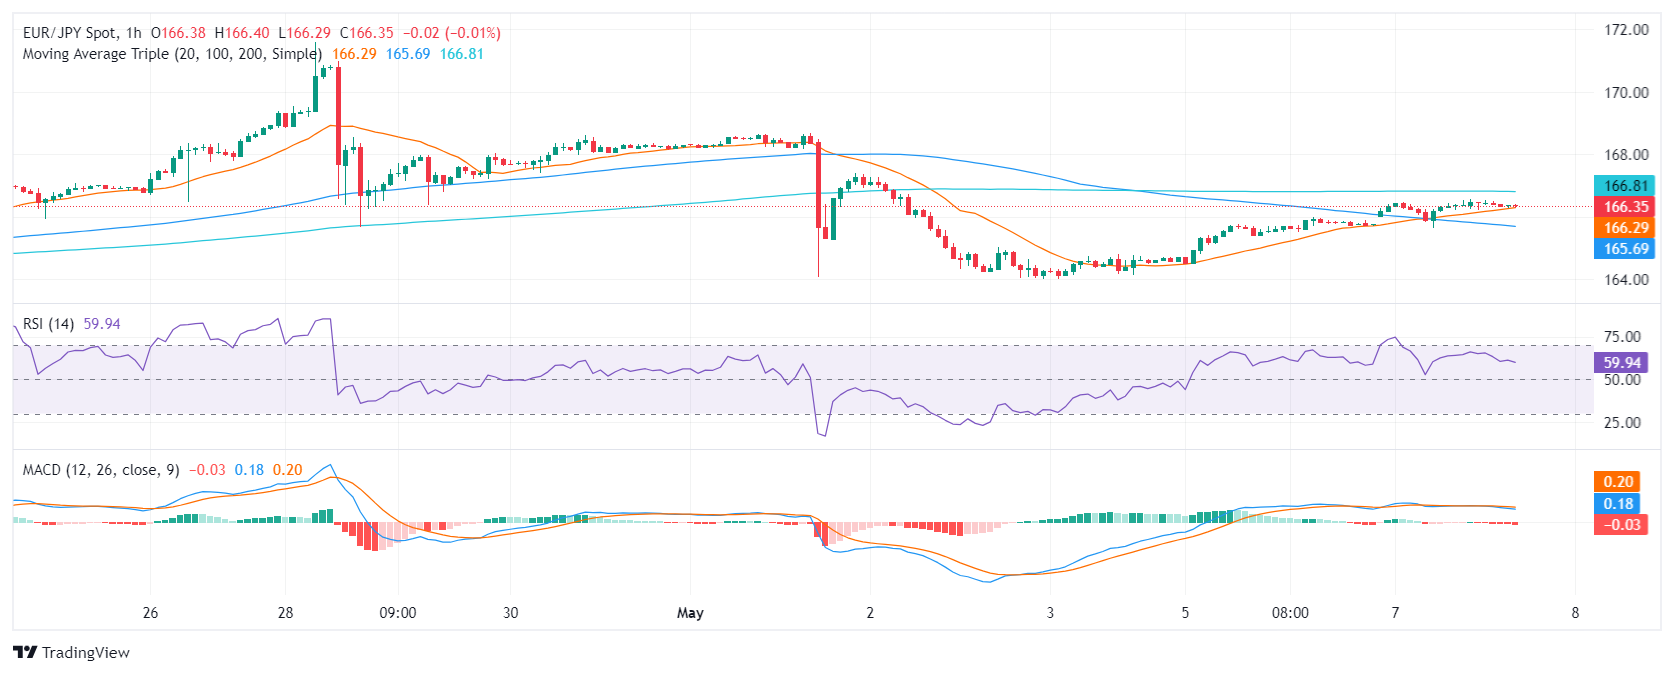
The hourly chart, comparatively, tells a slightly different story. The hourly RSI shows some fluctuating movement, straddling the positive domain. The most recent reading of 59 suggests a balance between buyers and sellers. This relatively flat RSI level suggests a consolidation phase. However, the MACD histogram remains stationary, printing flat red bars and emphasizing the lack of strong momentum on either side of the market.
EUR/JPY hourly chart
From a broader market perspective, EUR/JPY has exhibited a strong bullish posture. The pair has ascended above its 20-day Simple Moving Average (SMA), reinforcing the trend as it also stands above the 100 and 200-day SMAs.
To summarize, while the daily RSI suggests strength among buyers, the stagnant hourly RSI and the stable, negative MACD indicate the market's current standstill or consolidation. Nevertheless, the positioning of SMAs underlines a strong bullish momentum in the short-to-long-term scenario for EUR/JPY. If buyers secure the regained 20-day SMA, the cross may be poised to retest the cycle highs above 171.00.


© 2000-2026. Bản quyền Teletrade.
Trang web này được quản lý bởi Teletrade D.J. LLC 2351 LLC 2022 (Euro House, Richmond Hill Road, Kingstown, VC0100, St. Vincent and the Grenadines).
Thông tin trên trang web không phải là cơ sở để đưa ra quyết định đầu tư và chỉ được cung cấp cho mục đích làm quen.
Giao dịch trên thị trường tài chính (đặc biệt là giao dịch sử dụng các công cụ biên) mở ra những cơ hội lớn và tạo điều kiện cho các nhà đầu tư sẵn sàng mạo hiểm để thu lợi nhuận, tuy nhiên nó mang trong mình nguy cơ rủi ro khá cao. Chính vì vậy trước khi tiến hành giao dịch cần phải xem xét mọi mặt vấn đề chấp nhận tiến hành giao dịch cụ thể xét theo quan điểm của nguồn lực tài chính sẵn có và mức độ am hiểu thị trường tài chính.
Sử dụng thông tin: sử dụng toàn bộ hay riêng biệt các dữ liệu trên trang web của công ty TeleTrade như một nguồn cung cấp thông tin nhất định. Việc sử dụng tư liệu từ trang web cần kèm theo liên kết đến trang teletrade.vn. Việc tự động thu thập số liệu cũng như thông tin từ trang web TeleTrade đều không được phép.
Xin vui lòng liên hệ với pr@teletrade.global nếu có câu hỏi.
ngân hàng