- Phân tích
- Tin tức và các công cụ
- Tin tức thị trường
- NZD/USD Price Analysis: Bearish momentum escalates, buyers struggle to hold ground
NZD/USD Price Analysis: Bearish momentum escalates, buyers struggle to hold ground
- The NZD/USD exhibits a bearish trend with growing selling pressure, accentuated by the stiff resistance at the 0.6040 level.
- Indicators are flattening on the daily chart as bulls are running out of steam.
The NZD/USD stands at 0.6005 seeing mild losses in Tuesday’s session. Market movements highlight strong bearish momentum following consecutive losing sessions. The overall trend reveals strengthening selling pressure, with the NZD/USD facing considerable resistance at the 0.6040-50 level. This suggests a potential continuation of the downward trend as sellers assert their market dominance and bulls struggle to gain further ground.
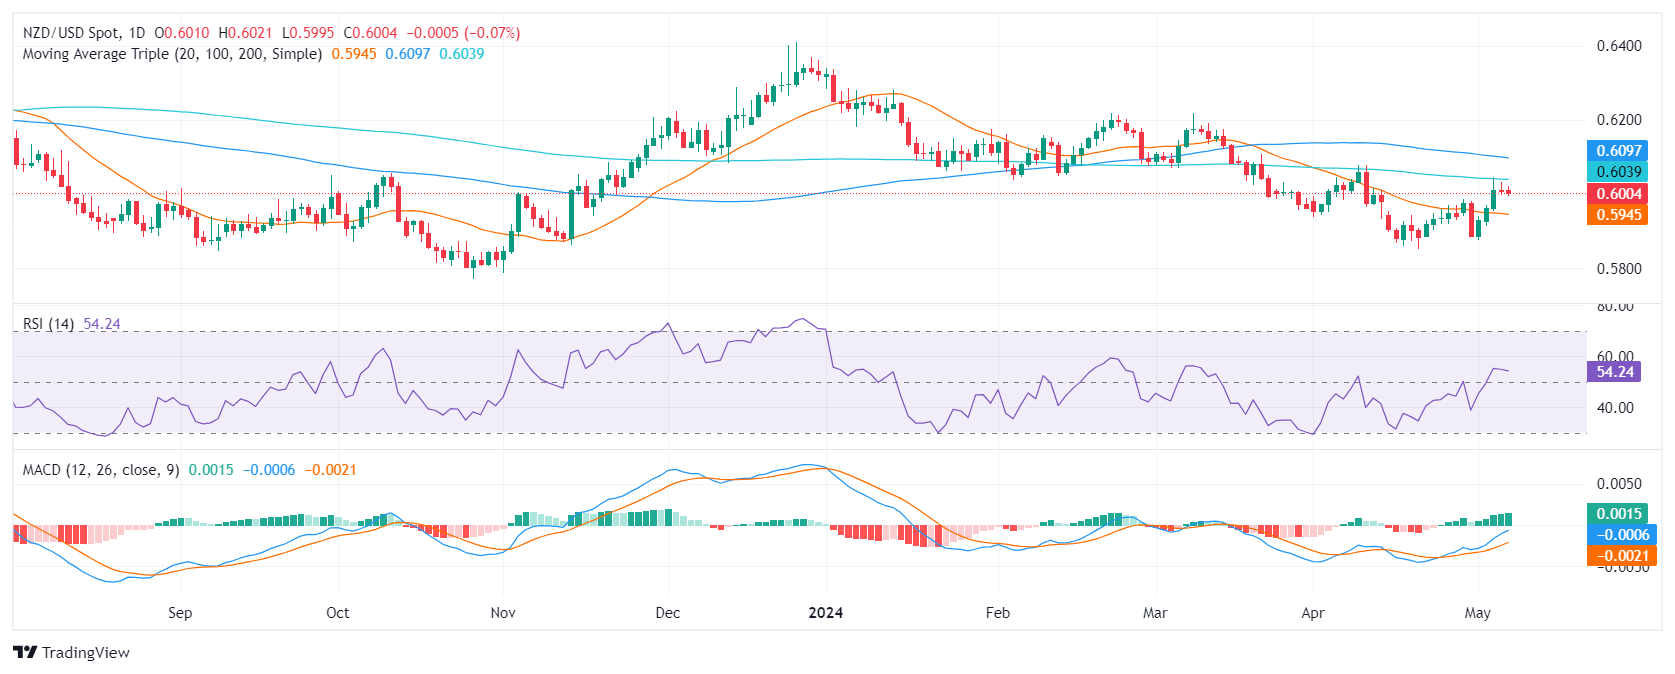
On the daily chart, the Relative Strength Index (RSI) for NZD/USD exhibits a recovery trend shifting from negative to positive territory. This trajectory indicates a gradual increase in buying interest but seems to have flattened. However, the Moving Average Convergence Divergence (MACD) histogram remains flat, reflecting stabilized momentum that does not favor either buyers or sellers dominantly.
NZD/USD daily chart
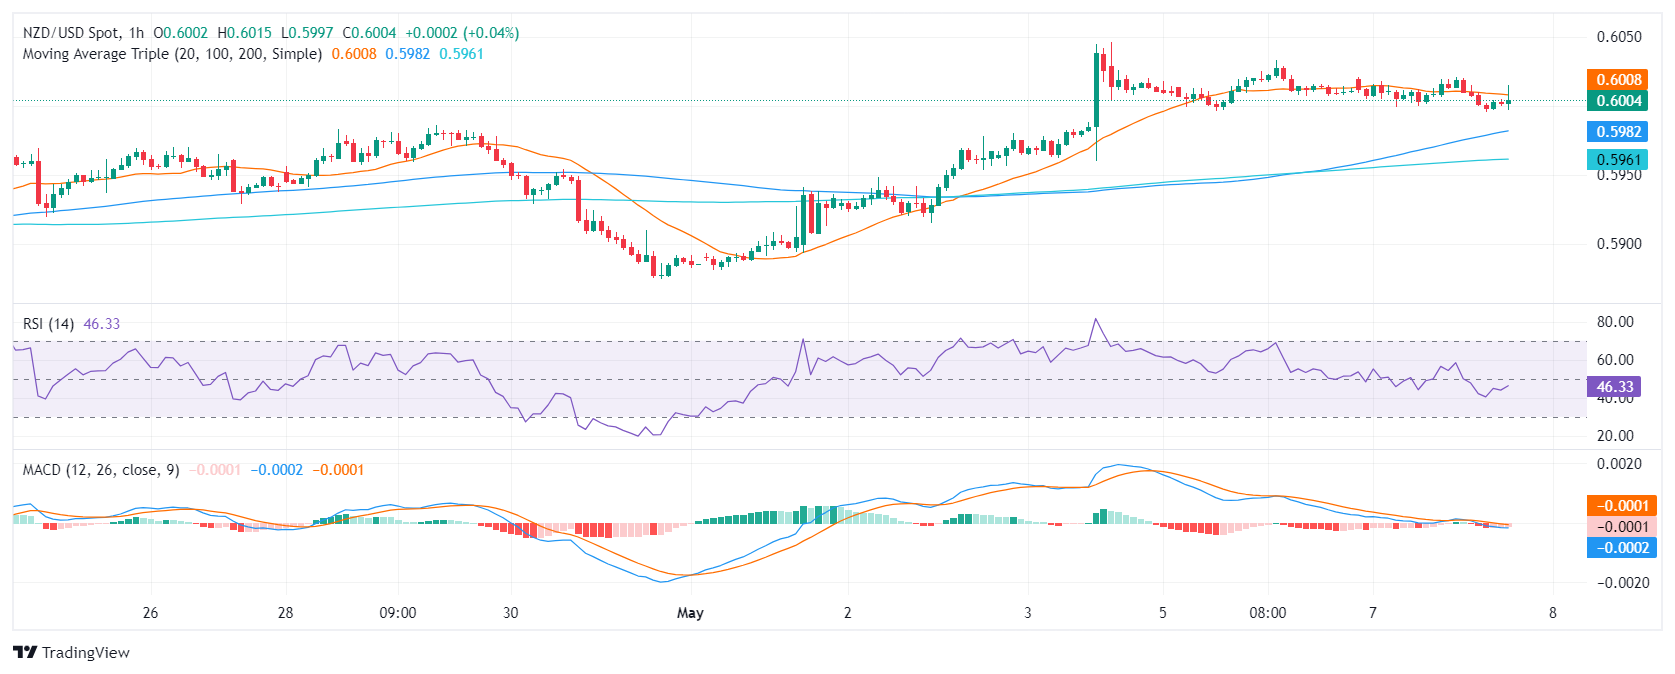
Shifting attention to the hourly chart, the NZD/USD pair presents a different narrative. The RSI flutters around in negative territory, showing sellers have a short-term advantage. Notably, the hourly MACD histogram presents flat red bars indicative of negative momentum persisting throughout the session.
NZD/USD hourly chart
In the grand scope, the mounting seller dominance is underscored by the NZD/USD's struggle to pierce the 200-day Simple Moving Average (SMA) at the 0.6040 level. This signifies a crucial resistance point for the pair. If the inability to break through persists, it could certainly reinforce the bearish trajectory in the next sessions. However, as long as the bulls hold above the 20-day SMA, the short-term outlook will remain tilted with some green.


© 2000-2026. Bản quyền Teletrade.
Trang web này được quản lý bởi Teletrade D.J. LLC 2351 LLC 2022 (Euro House, Richmond Hill Road, Kingstown, VC0100, St. Vincent and the Grenadines).
Thông tin trên trang web không phải là cơ sở để đưa ra quyết định đầu tư và chỉ được cung cấp cho mục đích làm quen.
Giao dịch trên thị trường tài chính (đặc biệt là giao dịch sử dụng các công cụ biên) mở ra những cơ hội lớn và tạo điều kiện cho các nhà đầu tư sẵn sàng mạo hiểm để thu lợi nhuận, tuy nhiên nó mang trong mình nguy cơ rủi ro khá cao. Chính vì vậy trước khi tiến hành giao dịch cần phải xem xét mọi mặt vấn đề chấp nhận tiến hành giao dịch cụ thể xét theo quan điểm của nguồn lực tài chính sẵn có và mức độ am hiểu thị trường tài chính.
Sử dụng thông tin: sử dụng toàn bộ hay riêng biệt các dữ liệu trên trang web của công ty TeleTrade như một nguồn cung cấp thông tin nhất định. Việc sử dụng tư liệu từ trang web cần kèm theo liên kết đến trang teletrade.vn. Việc tự động thu thập số liệu cũng như thông tin từ trang web TeleTrade đều không được phép.
Xin vui lòng liên hệ với pr@teletrade.global nếu có câu hỏi.
ngân hàng