- Phân tích
- Tin tức và các công cụ
- Tin tức thị trường
- EUR/JPY Price Analysis: Bulls maintain the reign and step over the bears
EUR/JPY Price Analysis: Bulls maintain the reign and step over the bears
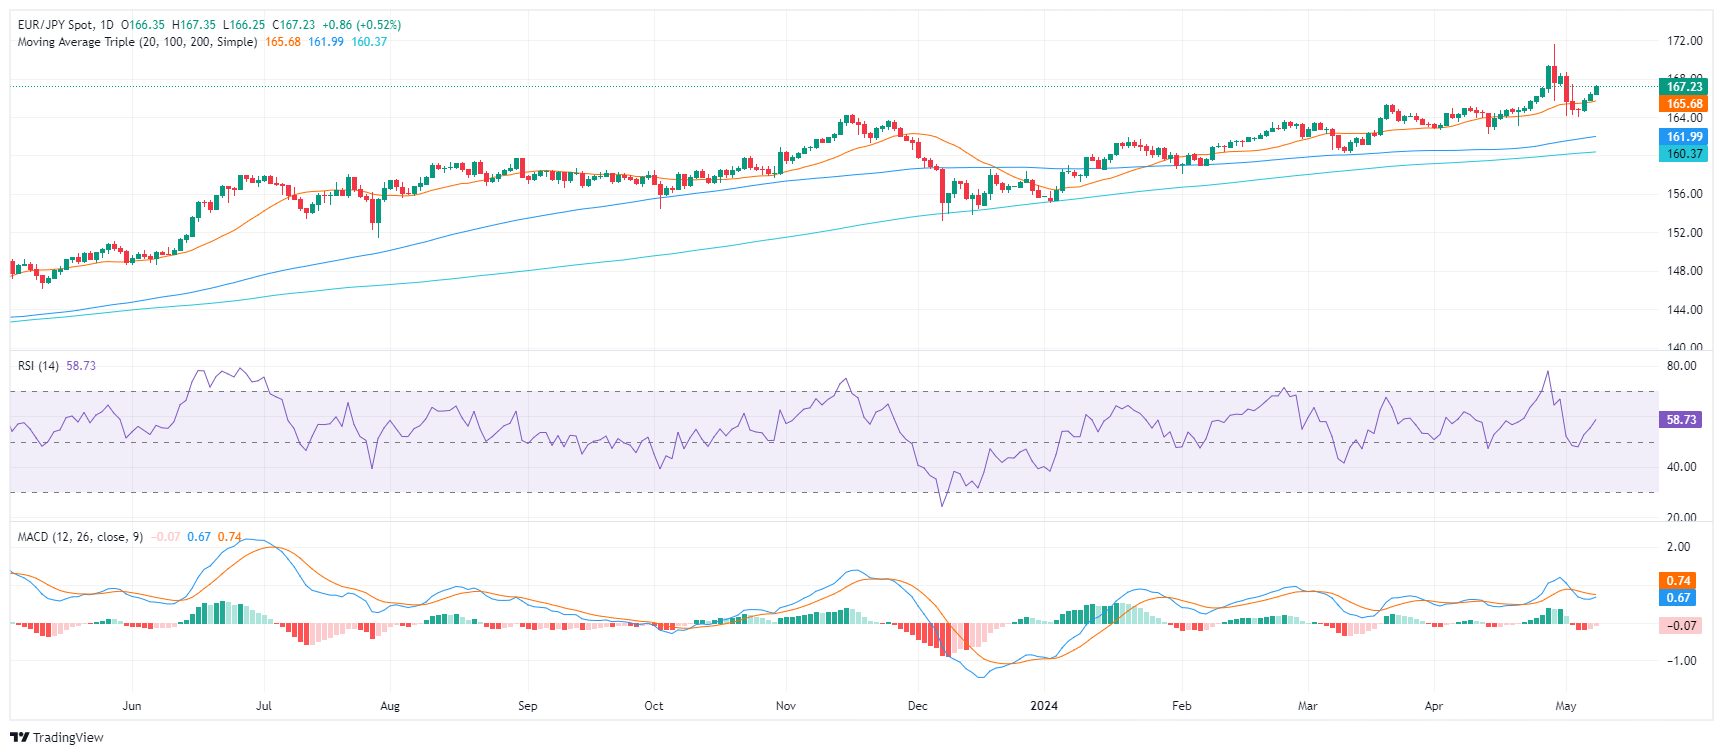
- Indicators on the daily chart show a consistent rise in bullish momentum.
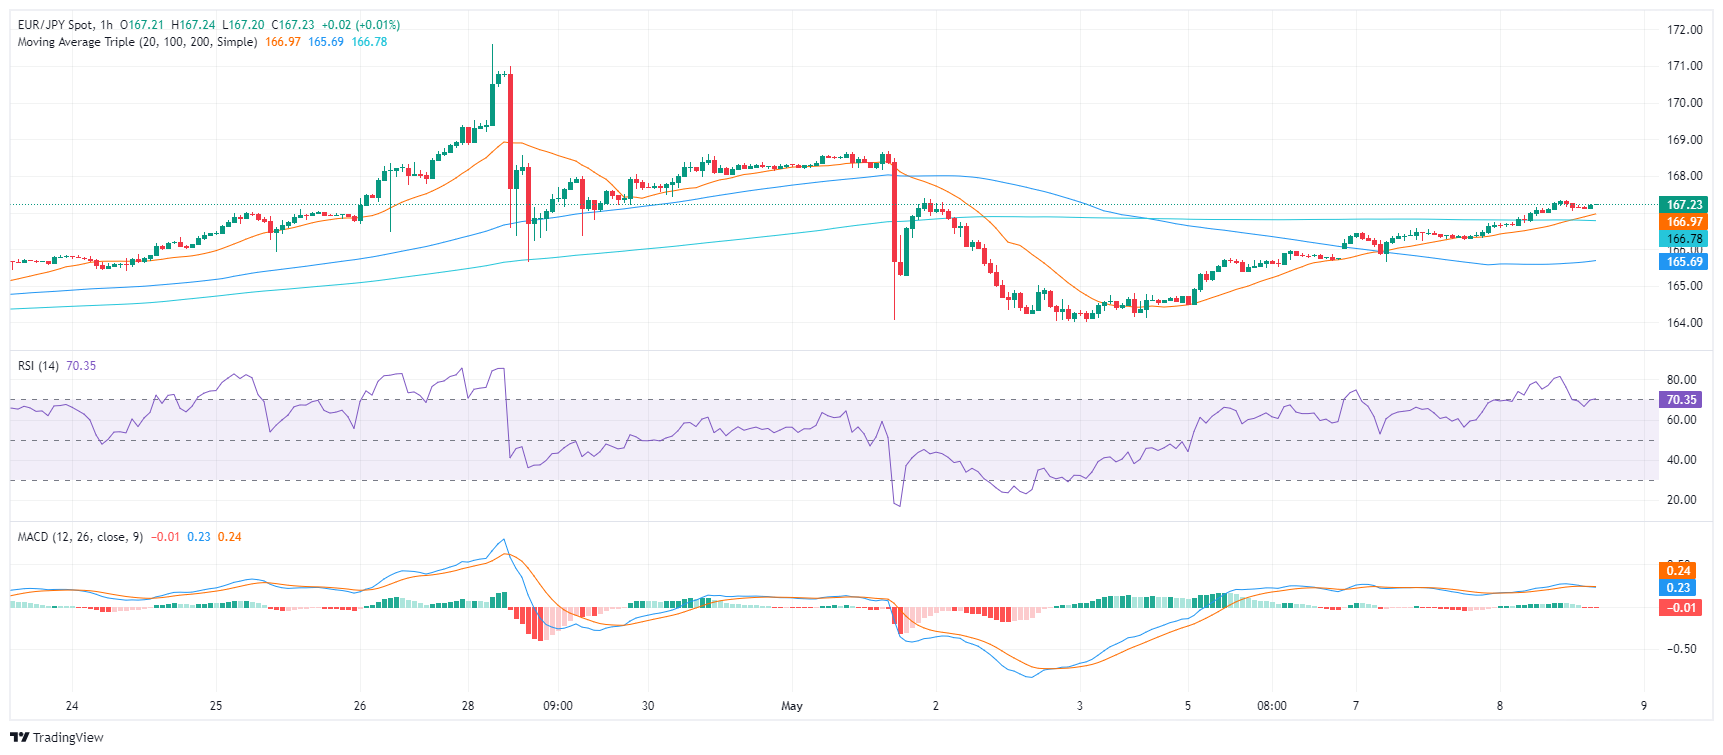
- On the hourly chart, the RSI reflects a more volatile picture with general positivity, yet the MACD shows a lack of sustained buying traction.
The EUR/JPY pair continues to exhibit strong momentum, displaying gains of 0.55% on Wednesday. With buyers maintaining dominance, the pair remains steadfast above its key Simple Moving Averages (SMAs) in both the short and long term, indicating the potential for a further upward move. The latest downward movements may have been only corrective as bears lacked the conviction to hold the pair below the 20-day SMA and buyers recovered ground.
On the daily chart, the Relative Strength Index (RSI) reveals a positive trend. The most recent value of 58 suggests that buyers have been dominating the market while the Moving Average Convergence Divergence (MACD) histogram shows green bars, indicating a consistent rise in positive momentum.
EUR/JPY daily chart
Shifting the focus to the hourly RSI, a more volatile picture is displayed. Values have fluctuated, generally remaining positive, with the latest reading at 69 near the overbought terrain. Whereas, the hourly MACD has registered flat red bars, indicating a lack of positive momentum in recent hours as investors seems to be taking profits.
EUR/JPY hourly chart
Reflecting on the broad spectrum, the EUR/JPY is currently positioned above its Simple Moving Average (SMA) across the 20, 100, and 200-days. This indicates a strong upward momentum in both the short-term and long-term periods.
In conclusion, the daily and hourly technical indicators and a notable position above the SMA suggest an overall bullish outlook for the pair. However, the contrast in the hourly MACD with the daily trends urges traders to exercise caution as buyers may take their foot off the gas ahead of the Asian session which would pave the way for some downside.


© 2000-2026. Bản quyền Teletrade.
Trang web này được quản lý bởi Teletrade D.J. LLC 2351 LLC 2022 (Euro House, Richmond Hill Road, Kingstown, VC0100, St. Vincent and the Grenadines).
Thông tin trên trang web không phải là cơ sở để đưa ra quyết định đầu tư và chỉ được cung cấp cho mục đích làm quen.
Giao dịch trên thị trường tài chính (đặc biệt là giao dịch sử dụng các công cụ biên) mở ra những cơ hội lớn và tạo điều kiện cho các nhà đầu tư sẵn sàng mạo hiểm để thu lợi nhuận, tuy nhiên nó mang trong mình nguy cơ rủi ro khá cao. Chính vì vậy trước khi tiến hành giao dịch cần phải xem xét mọi mặt vấn đề chấp nhận tiến hành giao dịch cụ thể xét theo quan điểm của nguồn lực tài chính sẵn có và mức độ am hiểu thị trường tài chính.
Sử dụng thông tin: sử dụng toàn bộ hay riêng biệt các dữ liệu trên trang web của công ty TeleTrade như một nguồn cung cấp thông tin nhất định. Việc sử dụng tư liệu từ trang web cần kèm theo liên kết đến trang teletrade.vn. Việc tự động thu thập số liệu cũng như thông tin từ trang web TeleTrade đều không được phép.
Xin vui lòng liên hệ với pr@teletrade.global nếu có câu hỏi.
ngân hàng