- Phân tích
- Tin tức và các công cụ
- Tin tức thị trường
- AUD/JPY Price Analysis: Faces resistance at Tenkan-Sen, as buyers eye 103.00
AUD/JPY Price Analysis: Faces resistance at Tenkan-Sen, as buyers eye 103.00
- AUD/JPY up 0.30%, showing bullish momentum for potential rise beyond 102.35.
- Bullish RSI indicates room for growth before hitting overbought conditions.
- Key levels: Resistance at Tenkan-Sen (102.42) and support at Kijun-Sen (101.36).
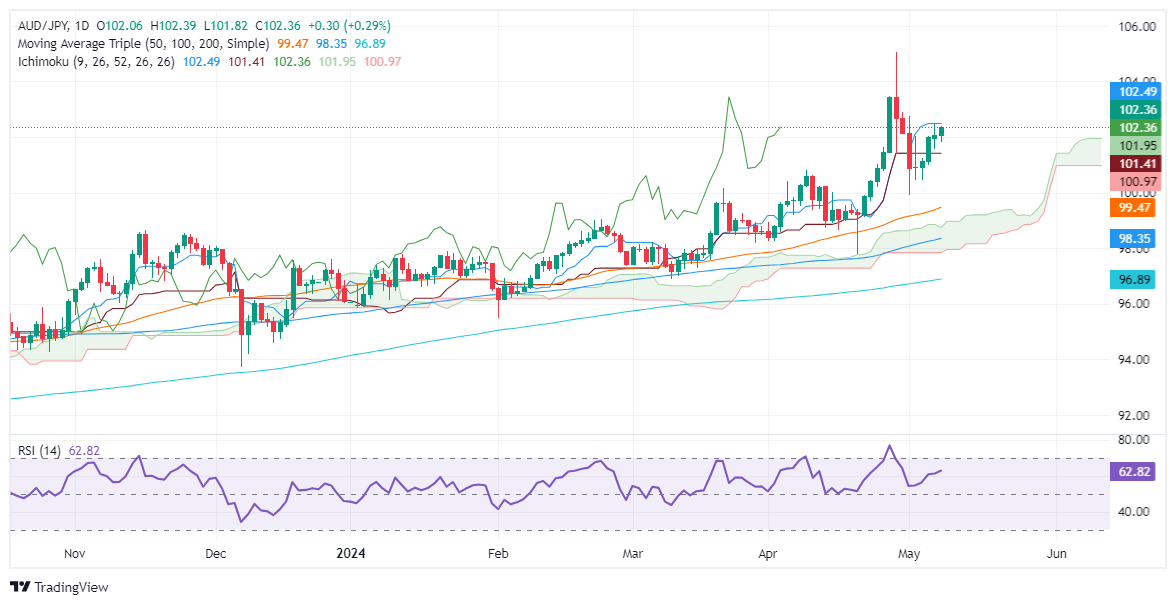
The AUD/JPY extends its gains for the fifth day in a row, climbs 0.30%, and trades at 102.35. Market sentiment remains upbeat, which usually weighs on the Japanese Yen (JPY) safe-haven appeal, which remains the laggard in the Forex markets against other peers.
AUD/JPY Price Analysis: Technical outlook
After reaching a year-to-date (YTD) high at 104.95, the AUD/JPY retreated towards 100.00, following a confirmed intervention by the Bank of Japan (BoJ). Since then, the pair has extended its gains, though it faces solid resistance at the Tenkan-Sen at 102.42.
Momentum favors buyers, with the Relative Strength Index (RSI) standing at bullish territory, aiming upwards with enough room before hitting overbought territory.
If AUD/JPY buyers want to re-test the YTD high, they must clear the Tenkan-Sen. Once surpassed, the 103.00 figure would emerge as the next stop, ahead of testing April’s 26 high at 103.47. Up next would be 104.00, followed by the YTD high.
On the other hand, buyers' failure to crack the Tenkan-Sen can pave the way for sellers to step in and push prices lower. The first support would be the 102.00 mark, followed by the Kijun-Sen at 101.36. Further losses are seen at the May 3 low at 100.45, followed by the 100.00 figure.
AUD/JPY Price Action – Daily Chart


© 2000-2026. Bản quyền Teletrade.
Trang web này được quản lý bởi Teletrade D.J. LLC 2351 LLC 2022 (Euro House, Richmond Hill Road, Kingstown, VC0100, St. Vincent and the Grenadines).
Thông tin trên trang web không phải là cơ sở để đưa ra quyết định đầu tư và chỉ được cung cấp cho mục đích làm quen.
Giao dịch trên thị trường tài chính (đặc biệt là giao dịch sử dụng các công cụ biên) mở ra những cơ hội lớn và tạo điều kiện cho các nhà đầu tư sẵn sàng mạo hiểm để thu lợi nhuận, tuy nhiên nó mang trong mình nguy cơ rủi ro khá cao. Chính vì vậy trước khi tiến hành giao dịch cần phải xem xét mọi mặt vấn đề chấp nhận tiến hành giao dịch cụ thể xét theo quan điểm của nguồn lực tài chính sẵn có và mức độ am hiểu thị trường tài chính.
Sử dụng thông tin: sử dụng toàn bộ hay riêng biệt các dữ liệu trên trang web của công ty TeleTrade như một nguồn cung cấp thông tin nhất định. Việc sử dụng tư liệu từ trang web cần kèm theo liên kết đến trang teletrade.vn. Việc tự động thu thập số liệu cũng như thông tin từ trang web TeleTrade đều không được phép.
Xin vui lòng liên hệ với pr@teletrade.global nếu có câu hỏi.
ngân hàng