- Phân tích
- Tin tức và các công cụ
- Tin tức thị trường
- EUR/JPY Price Analysis: Buyers accelerate the pace eye cycle highs
EUR/JPY Price Analysis: Buyers accelerate the pace eye cycle highs
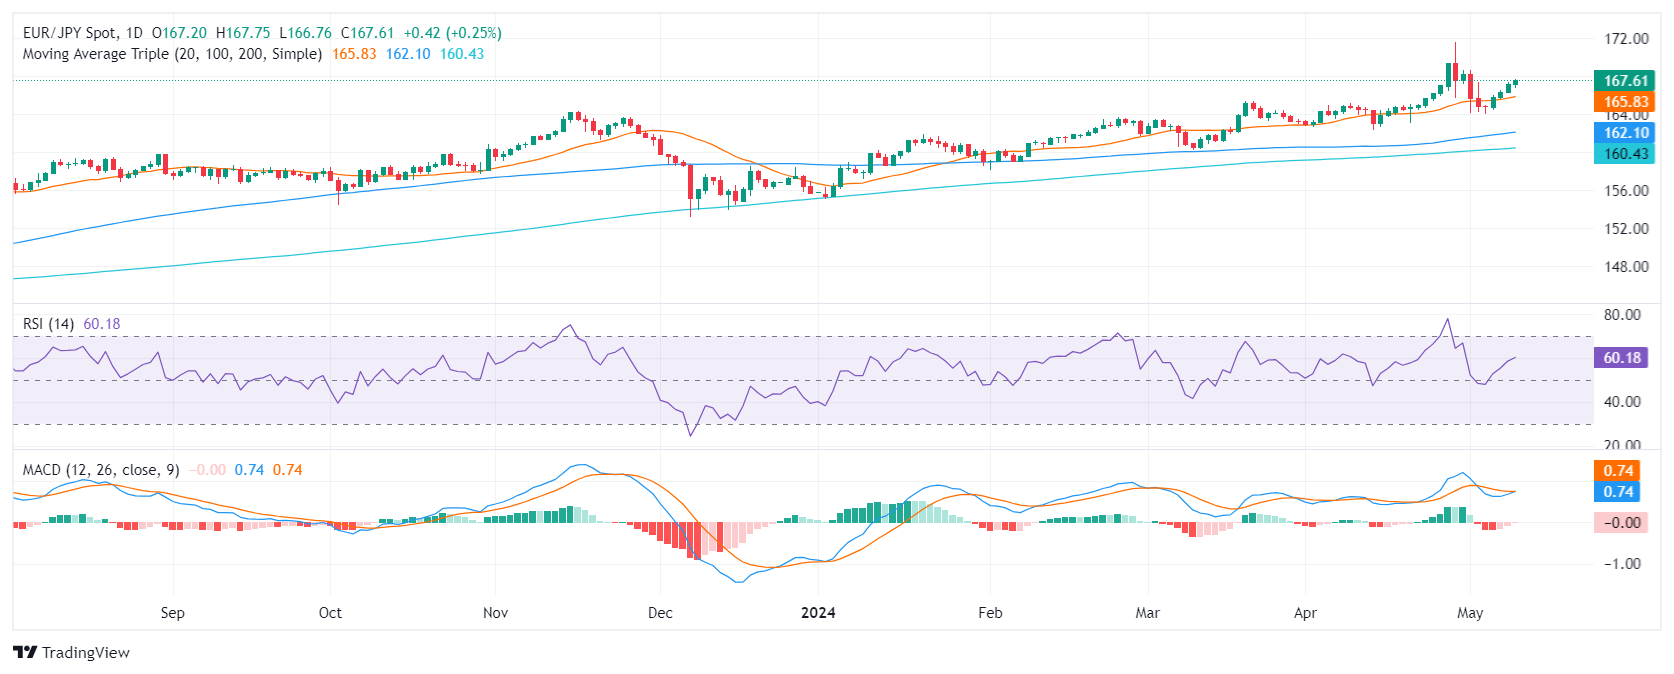
- The daily chart reveals the RSI steady in positive zone, showing consistent bullish momentum.
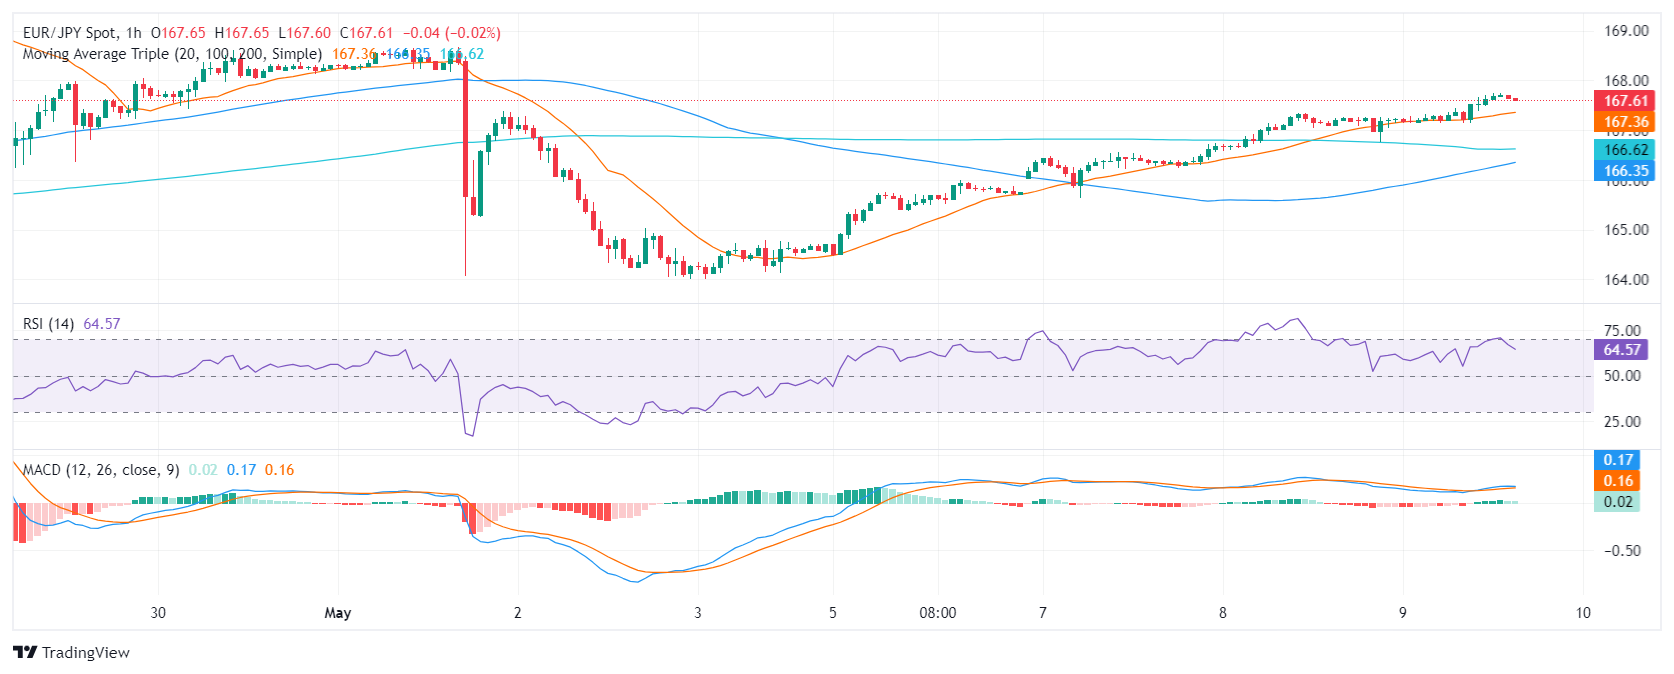
- On the hourly chart, RSI and MACD persist in positive territory, indicating robust buying traction.
- If the bears don’t show up, the pair may be poised for a retest of the cycle highs above 170.00.
The EUR/JPY pair is steadily maintaining its upward trajectory, with a decisive rise to 167.64 in Thursday's session. Buyers consolidate near cycle highs while bears are nowhere to be seen.
On the daily chart, the Relative Strength Index (RSI) is noted in the positive territory. A consistent upward trend has unfolded over recent sessions, with the current RSI value at 59.8, showcasing continuous bullish momentum. Concurrently, the Moving Average Convergence Divergence (MACD) shows red bars decreasing in length, which suggests the decelerating negative momentum.
EUR/JPY Daily Chart
Ensuing examination of the hourly chart demonstrates a parallel bullish outlook. The hourly RSI values persistently float around the positive territory, with the recent reading at 64 seeming to consolidating after hitting overbought conditions. Additionally, the hourly MACD represents flat green bars, indicating steady positive momentum.
EUR/JPY Hourly Chart
Upon observing the Simple Moving Average (SMA), the EUR/JPY pair remains in a visibly secure territory. Both short- and long-term SMAs convey a sustained upward trajectory, indicating pronounced bullish momentum. Specifically, the pair secures its position above the 20, 100, and 200-day SMA, conveying a consistent bullish outlook.


© 2000-2026. Bản quyền Teletrade.
Trang web này được quản lý bởi Teletrade D.J. LLC 2351 LLC 2022 (Euro House, Richmond Hill Road, Kingstown, VC0100, St. Vincent and the Grenadines).
Thông tin trên trang web không phải là cơ sở để đưa ra quyết định đầu tư và chỉ được cung cấp cho mục đích làm quen.
Giao dịch trên thị trường tài chính (đặc biệt là giao dịch sử dụng các công cụ biên) mở ra những cơ hội lớn và tạo điều kiện cho các nhà đầu tư sẵn sàng mạo hiểm để thu lợi nhuận, tuy nhiên nó mang trong mình nguy cơ rủi ro khá cao. Chính vì vậy trước khi tiến hành giao dịch cần phải xem xét mọi mặt vấn đề chấp nhận tiến hành giao dịch cụ thể xét theo quan điểm của nguồn lực tài chính sẵn có và mức độ am hiểu thị trường tài chính.
Sử dụng thông tin: sử dụng toàn bộ hay riêng biệt các dữ liệu trên trang web của công ty TeleTrade như một nguồn cung cấp thông tin nhất định. Việc sử dụng tư liệu từ trang web cần kèm theo liên kết đến trang teletrade.vn. Việc tự động thu thập số liệu cũng như thông tin từ trang web TeleTrade đều không được phép.
Xin vui lòng liên hệ với pr@teletrade.global nếu có câu hỏi.
ngân hàng