- Phân tích
- Tin tức và các công cụ
- Tin tức thị trường
- USD/CHF Price Analysis: Bears moved in as ‘evening star’ pattern looms
USD/CHF Price Analysis: Bears moved in as ‘evening star’ pattern looms
- USD/CHF falls 0.16%, trading below 0.9100 due to broader US dollar weakness.
- Technicals show neutral to upward bias; recent bearish RSI indicates loss of upward momentum.
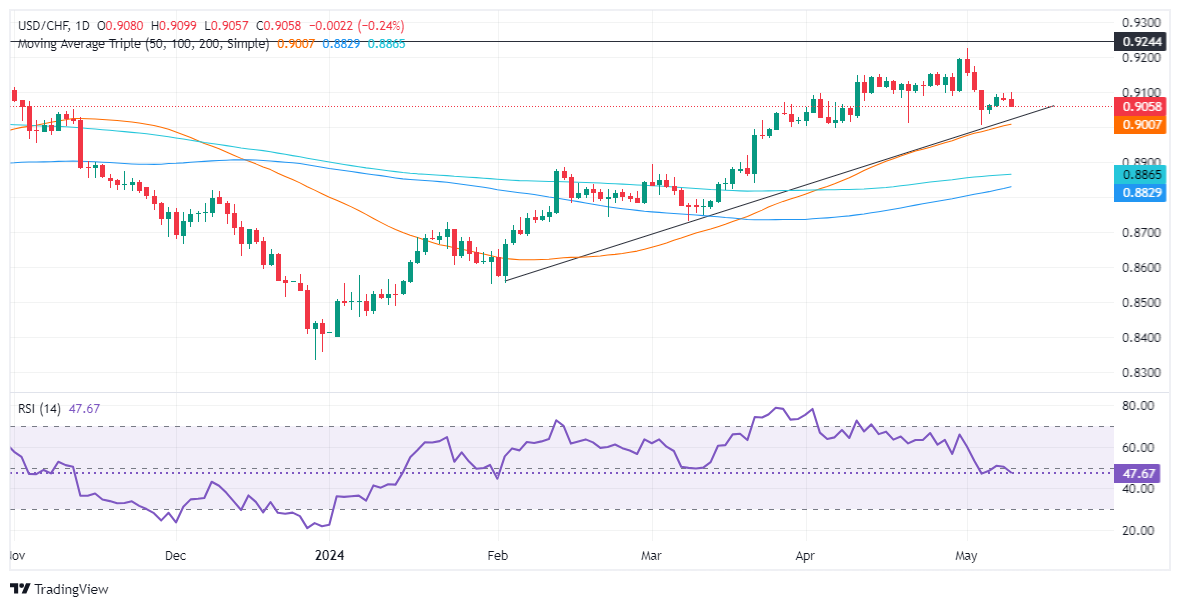
- Key support at 0.9006 (50-day MA and support trendline); resistance at 0.9100 and 0.9174.
The USD/CHF extended its losses for two straight days and is down some 0.16%, courtesy of broad US Dollar weakness, undermined by lower US Treasury yields. The major trades at 0.9064 after hitting a high shy of 0.9100.
USD/CHF Price Analysis: Technical outlook
The daily chart depicts the USD/CHF as neutral to upward biased, despite buyers losing momentum, as shown by the Relative Strength Index (RSI) shifting bearish. Although the pair has lost some 1.80% after hitting a year-to-date (YTD) high of 0.9224, solid support seen at the confluence of the 50-day moving average and a support trendline at around 0.9006/30 might cap the pair’s drop.
Looking at the potential for a bullish continuation, the USD/CHF could see a positive turn if it manages to climb above 0.9100. Once this level is breached, the next immediate resistance level to watch out for would be May 2 high at 0.9174, with a further test at 0.9200.
On the other hand, if bears push prices below 0.9000, that will confirm the ‘evening star’ chart pattern and exacerbate a drop toward the 200-DMA at 0.8887, ahead of the 100-DMA at 0.8829.
USD/CHF Price Action – Daily Chart


© 2000-2026. Bản quyền Teletrade.
Trang web này được quản lý bởi Teletrade D.J. LLC 2351 LLC 2022 (Euro House, Richmond Hill Road, Kingstown, VC0100, St. Vincent and the Grenadines).
Thông tin trên trang web không phải là cơ sở để đưa ra quyết định đầu tư và chỉ được cung cấp cho mục đích làm quen.
Giao dịch trên thị trường tài chính (đặc biệt là giao dịch sử dụng các công cụ biên) mở ra những cơ hội lớn và tạo điều kiện cho các nhà đầu tư sẵn sàng mạo hiểm để thu lợi nhuận, tuy nhiên nó mang trong mình nguy cơ rủi ro khá cao. Chính vì vậy trước khi tiến hành giao dịch cần phải xem xét mọi mặt vấn đề chấp nhận tiến hành giao dịch cụ thể xét theo quan điểm của nguồn lực tài chính sẵn có và mức độ am hiểu thị trường tài chính.
Sử dụng thông tin: sử dụng toàn bộ hay riêng biệt các dữ liệu trên trang web của công ty TeleTrade như một nguồn cung cấp thông tin nhất định. Việc sử dụng tư liệu từ trang web cần kèm theo liên kết đến trang teletrade.vn. Việc tự động thu thập số liệu cũng như thông tin từ trang web TeleTrade đều không được phép.
Xin vui lòng liên hệ với pr@teletrade.global nếu có câu hỏi.
ngân hàng