- Phân tích
- Tin tức và các công cụ
- Tin tức thị trường
- NZD/USD Price Analysis: Buyers gather momentum and challenge the 200-day SMA
NZD/USD Price Analysis: Buyers gather momentum and challenge the 200-day SMA
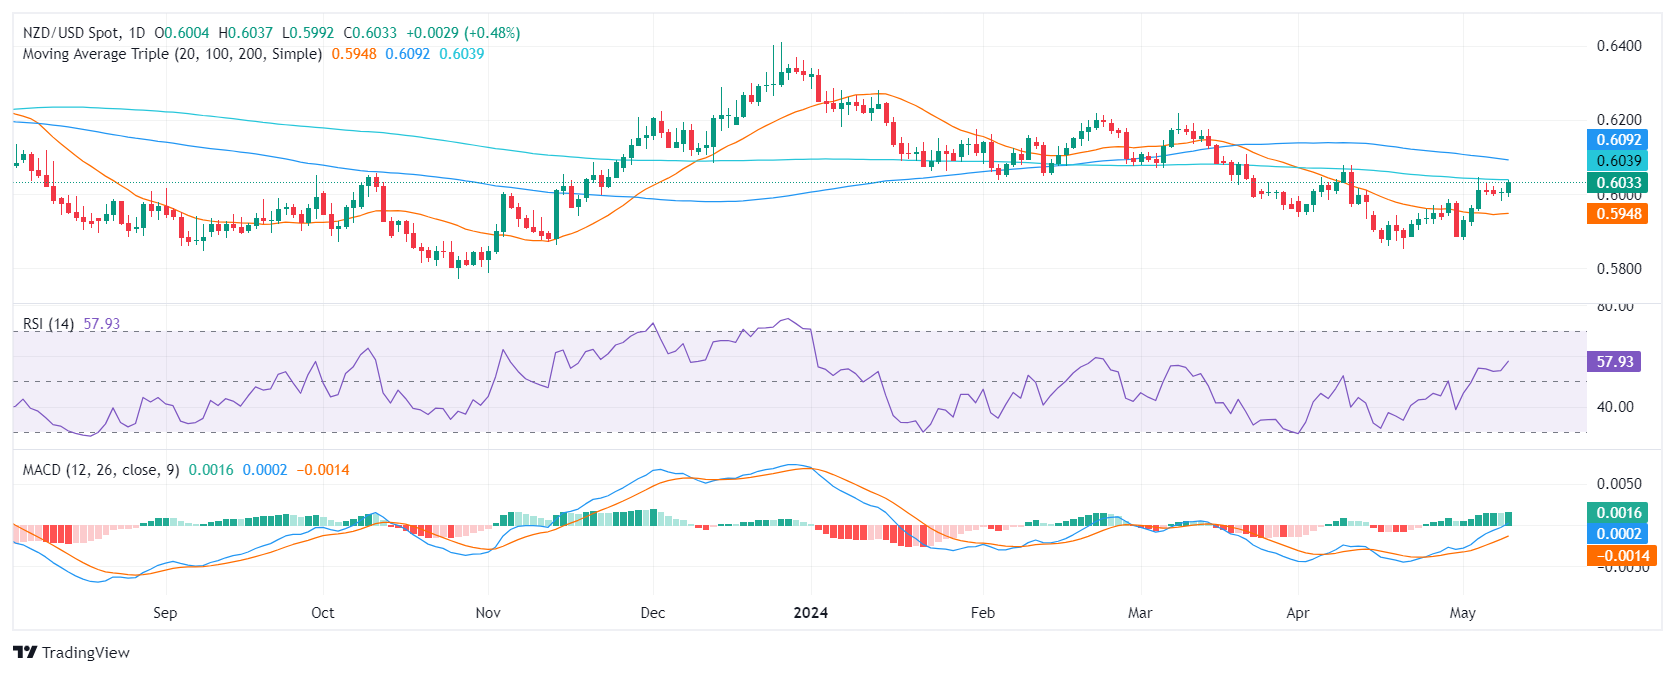
- The daily RSI for the NZD/USD reveals strong buying momentum, underpinned by rising MACD green bars.
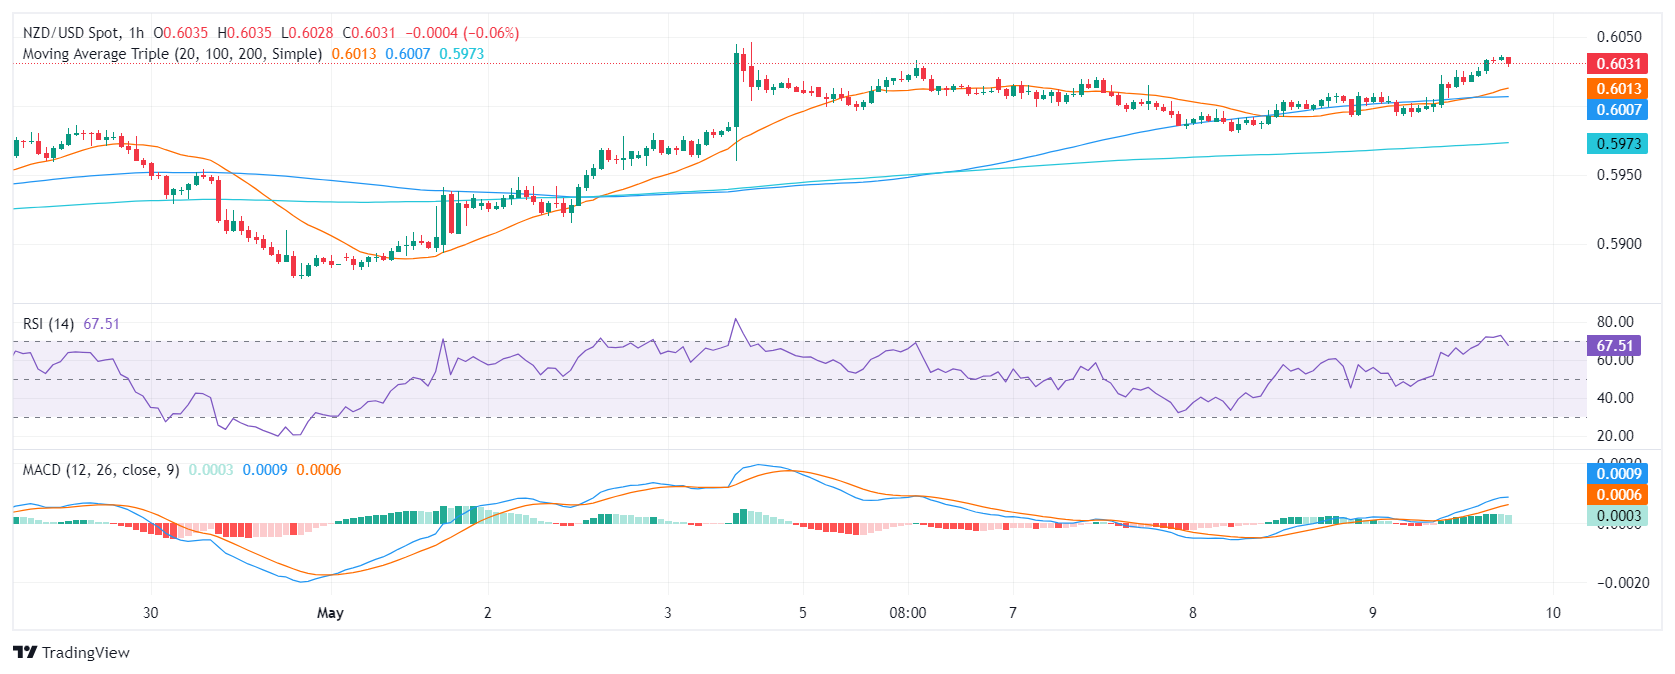
- Despite slightly weakening green bars on the hourly MACD, the RSI indicates steadfast buying traction near 70.
- If buyers regain the 200-day SMA, the outlook will turn positive for the pair.
The NZD/USD pair is showcasing a strong performance, rising to 0.6032 on Thursday. Despite this, an observed stagnation in hourly advances warrants attention for any short-term shift as indicators reach overbought conditions and buyers might take profits.
On the daily chart, the Relative Strength Index (RSI) shows positive momentum. Its latest reading is in positive territory. This, along with the rising green bars of the Moving Average Convergence Divergence (MACD), indicates a market predominately dominated by buyers.
NZD/USD daily chart
Turning attention to the hourly chart, the RSI still indicates strong buyer domination, hovering around 66. However, the MACD shows decreasing green bars, which could indicate slightly weaker bullish momentum compared to the daily chart. Traders shouldn’t take off the table a slight technical correction ahead of the Asian session.
NZD/USD hourly chart
Regarding the Simple Moving Averages (SMA) the pair holds above the 20-day SMA but remains below the 100 and 200-day. However, buyers are anticipated to challenge the 200-day SMA at the critical level of 0.6040 which if surpassed, could usher in stronger bullish prospects for the NZD/USD. On the contrary, sellers might step in again if the pair lacks the strength to reconquer the mentioned resistance.


© 2000-2026. Bản quyền Teletrade.
Trang web này được quản lý bởi Teletrade D.J. LLC 2351 LLC 2022 (Euro House, Richmond Hill Road, Kingstown, VC0100, St. Vincent and the Grenadines).
Thông tin trên trang web không phải là cơ sở để đưa ra quyết định đầu tư và chỉ được cung cấp cho mục đích làm quen.
Giao dịch trên thị trường tài chính (đặc biệt là giao dịch sử dụng các công cụ biên) mở ra những cơ hội lớn và tạo điều kiện cho các nhà đầu tư sẵn sàng mạo hiểm để thu lợi nhuận, tuy nhiên nó mang trong mình nguy cơ rủi ro khá cao. Chính vì vậy trước khi tiến hành giao dịch cần phải xem xét mọi mặt vấn đề chấp nhận tiến hành giao dịch cụ thể xét theo quan điểm của nguồn lực tài chính sẵn có và mức độ am hiểu thị trường tài chính.
Sử dụng thông tin: sử dụng toàn bộ hay riêng biệt các dữ liệu trên trang web của công ty TeleTrade như một nguồn cung cấp thông tin nhất định. Việc sử dụng tư liệu từ trang web cần kèm theo liên kết đến trang teletrade.vn. Việc tự động thu thập số liệu cũng như thông tin từ trang web TeleTrade đều không được phép.
Xin vui lòng liên hệ với pr@teletrade.global nếu có câu hỏi.
ngân hàng