- Phân tích
- Tin tức và các công cụ
- Tin tức thị trường
- GBP/JPY Price Analysis: Bulls maintain stronghold, despite profit take-off
GBP/JPY Price Analysis: Bulls maintain stronghold, despite profit take-off
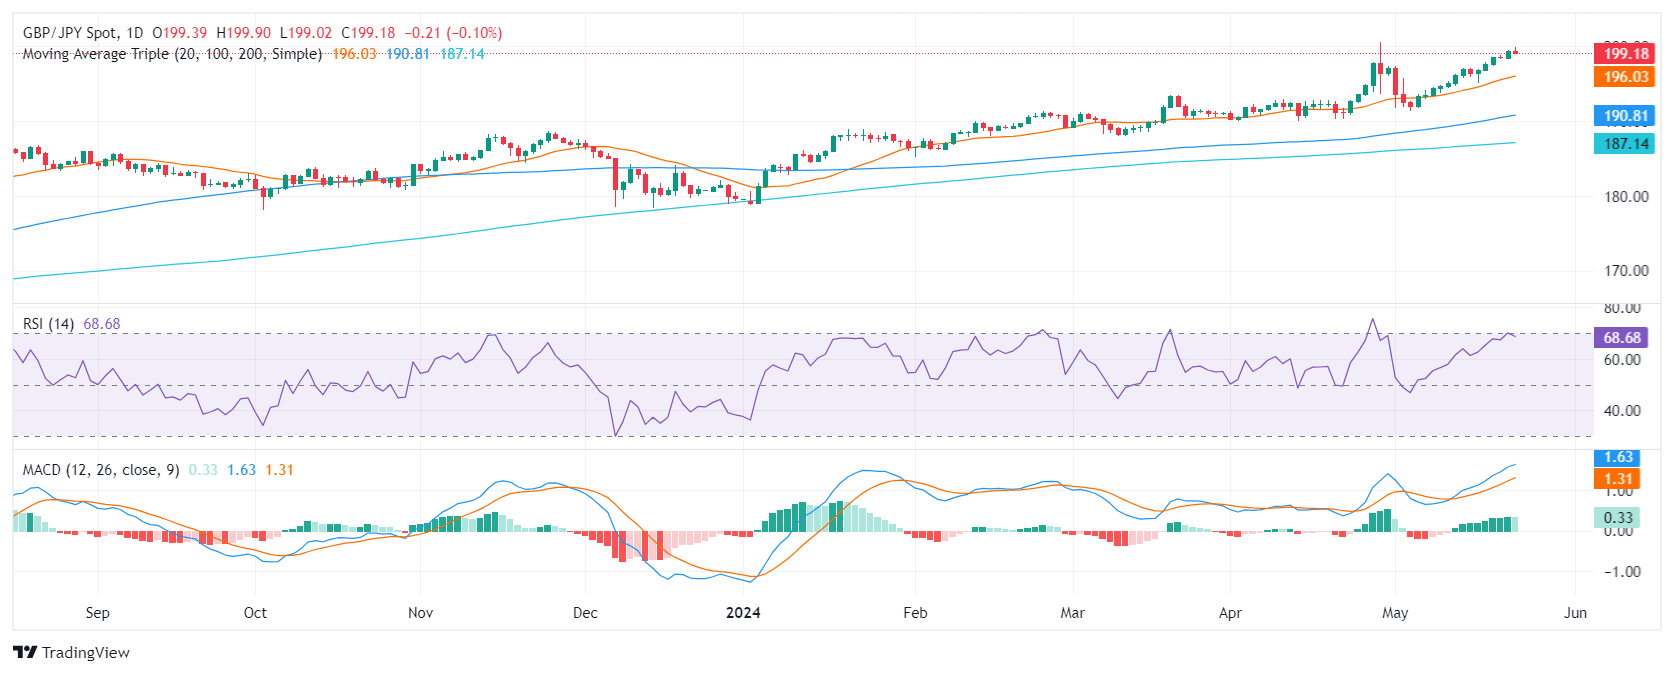
- The daily chart shows that the bulls are taking their foot off the gas and started to take profits.
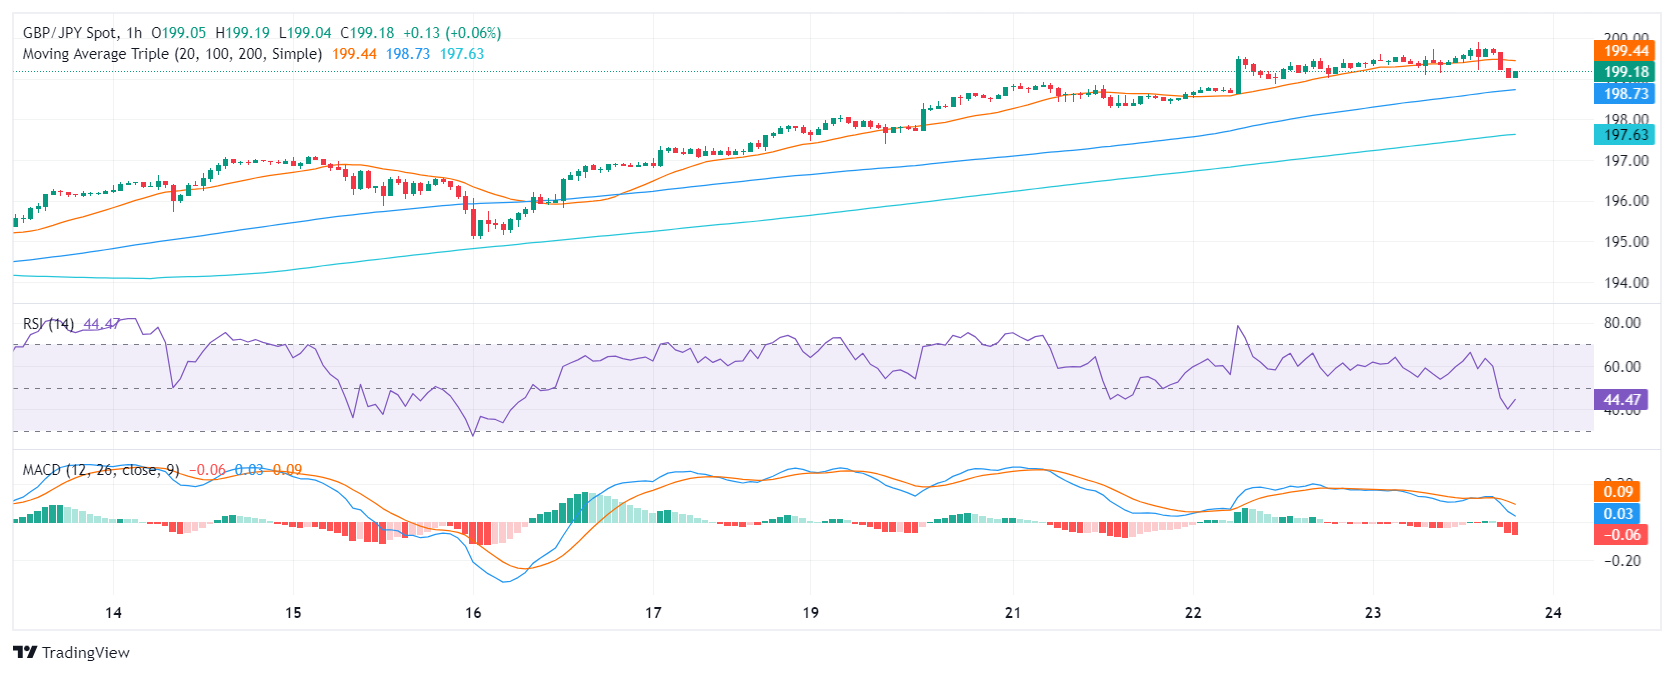
- The hourly chart shows signs of short-term selling pressure ahead of the Asian session.
- The main support to hold is the 20-day SMA at 196.00.
On Thursday's session, the GBP/JPY declined to 199.20 but holds an overall positive outlook. This theory is backed up by the pair approaching near-cycle highs. If the cross holds the 20-day Simple Moving Average (SMA) at 196.00, the downward movements could be considered corrective.
In the daily chart, the Relative Strength Index (RSI) exhibits heightened bullish momentum as it comfortably resides in positive territory nearing overbought conditions but seems to be flattening. Simultaneously, the Moving Average Convergence Divergence (MACD) reveals a decreasing bullish momentum, distinguished by falling green bars. This indicates that while buyers currently hold the reins, their influence may be abating.
GBP/JPY daily chart
Switching to the hourly chart, the RSI portrays a contrasting bearish tendency, with the latest reading of approximately 44, dipping into negative territory. A declining trend is corroborated by the MACD's ascending red bars, suggesting a surge in negative momentum as sellers gain influence in the short term.
GBP/JPY hourly chart
To conclude, the GBP/JPY pair rose near cycle highs, and indicators reached overbought conditions which may trigger a corrective phase. Ahead of the Asian session, investors are taking profits, evident in the hourly chart where indicators are in the red. However, as long as the pair holds above the 20,100 and 200-day SMAs, the outlook will be bullish.


© 2000-2026. Bản quyền Teletrade.
Trang web này được quản lý bởi Teletrade D.J. LLC 2351 LLC 2022 (Euro House, Richmond Hill Road, Kingstown, VC0100, St. Vincent and the Grenadines).
Thông tin trên trang web không phải là cơ sở để đưa ra quyết định đầu tư và chỉ được cung cấp cho mục đích làm quen.
Giao dịch trên thị trường tài chính (đặc biệt là giao dịch sử dụng các công cụ biên) mở ra những cơ hội lớn và tạo điều kiện cho các nhà đầu tư sẵn sàng mạo hiểm để thu lợi nhuận, tuy nhiên nó mang trong mình nguy cơ rủi ro khá cao. Chính vì vậy trước khi tiến hành giao dịch cần phải xem xét mọi mặt vấn đề chấp nhận tiến hành giao dịch cụ thể xét theo quan điểm của nguồn lực tài chính sẵn có và mức độ am hiểu thị trường tài chính.
Sử dụng thông tin: sử dụng toàn bộ hay riêng biệt các dữ liệu trên trang web của công ty TeleTrade như một nguồn cung cấp thông tin nhất định. Việc sử dụng tư liệu từ trang web cần kèm theo liên kết đến trang teletrade.vn. Việc tự động thu thập số liệu cũng như thông tin từ trang web TeleTrade đều không được phép.
Xin vui lòng liên hệ với pr@teletrade.global nếu có câu hỏi.
ngân hàng