- Phân tích
- Tin tức và các công cụ
- Tin tức thị trường
- AUD/JPY Price Analysis: Breaks below 104.00, followed by support at 14-day EMA
AUD/JPY Price Analysis: Breaks below 104.00, followed by support at 14-day EMA
- AUD/JPY could test the key level of 104.00, followed by the upper boundary of the ascending triangle.
- The momentum indicator 14-day RSI suggests the confirmation of the bullish bias for the pair.
- The immediate support appears around the 14-day EMA at 103.63 and the lower threshold of the ascending triangle.
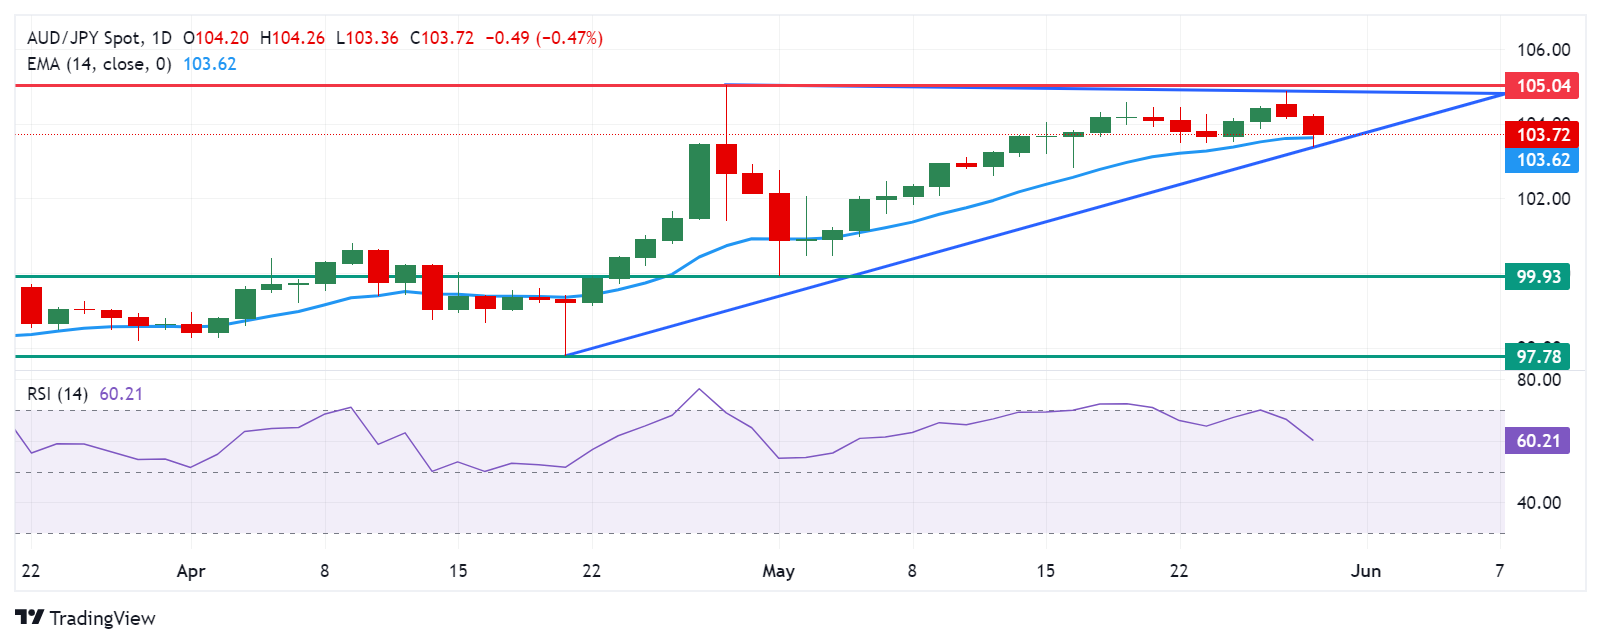
AUD/JPY extends its losses to near 103.80 during European trading hours on Thursday. However, the analysis of the daily chart indicates a bullish bias for the AUD/JPY pair, as it remains within an ascending triangle. Furthermore, the momentum indicator 14-day Relative Strength Index (RSI) is above the 50 level, suggesting confirmation of the bullish outlook.
The AUD/JPY cross could test the immediate resistance at the psychological level of 104.00, followed by the upper boundary of the ascending triangle around 104.80. A breakthrough above this level could reinforce the bullish sentiment, potentially pushing the cross past the psychological level of 105.00, aligning with the highest level of 105.04, which has not been seen since April 2013.
On the downside, the 14-day Exponential Moving Average (EMA) at 103.62 serves as immediate support for the AUD/JPY cross, followed by the lower threshold of the ascending triangle around the key level of 103.50.
A break below the latter could lead the AUD/JPY cross to navigate the region around the psychological level of 100.00 and the throwback support at 99.93. Further decline could exert downward pressure on the cross, potentially driving it toward April's low of 97.78.
AUD/JPY: Daily Chart


© 2000-2026. Bản quyền Teletrade.
Trang web này được quản lý bởi Teletrade D.J. LLC 2351 LLC 2022 (Euro House, Richmond Hill Road, Kingstown, VC0100, St. Vincent and the Grenadines).
Thông tin trên trang web không phải là cơ sở để đưa ra quyết định đầu tư và chỉ được cung cấp cho mục đích làm quen.
Giao dịch trên thị trường tài chính (đặc biệt là giao dịch sử dụng các công cụ biên) mở ra những cơ hội lớn và tạo điều kiện cho các nhà đầu tư sẵn sàng mạo hiểm để thu lợi nhuận, tuy nhiên nó mang trong mình nguy cơ rủi ro khá cao. Chính vì vậy trước khi tiến hành giao dịch cần phải xem xét mọi mặt vấn đề chấp nhận tiến hành giao dịch cụ thể xét theo quan điểm của nguồn lực tài chính sẵn có và mức độ am hiểu thị trường tài chính.
Sử dụng thông tin: sử dụng toàn bộ hay riêng biệt các dữ liệu trên trang web của công ty TeleTrade như một nguồn cung cấp thông tin nhất định. Việc sử dụng tư liệu từ trang web cần kèm theo liên kết đến trang teletrade.vn. Việc tự động thu thập số liệu cũng như thông tin từ trang web TeleTrade đều không được phép.
Xin vui lòng liên hệ với pr@teletrade.global nếu có câu hỏi.
ngân hàng