- Phân tích
- Tin tức và các công cụ
- Tin tức thị trường
- AUD/NZD gains ground on robust Australian data, markets digest NZ tax relief
AUD/NZD gains ground on robust Australian data, markets digest NZ tax relief
- The AUD/NZD rebounded to a high of 1.0840 after dipping to 1.0815 on Wednesday.
- Strong data from Australia following the report of hot inflation figures reported at the beginning of the week benefited the AUD.
- New Zealand's newly announced tax cut policy may delay the RBNZ's rate cuts.
The AUD/NZD was seen trading higher during Thursday's session as markets digested mid-tier Australian data and a fresh fiscal policy from New Zealand.
In Australia, the robust Q1 business investment and higher-than-expected private capital expenditure figures supported the AUD. On Tuesday, the country reported higher-than-expected inflation figures which coupled with strong economic data may prompt the Reserve Bank of Australia (RBA) to turn more hawkish. On Wednesday Gross Domestic Product (GDP) will be closely followed.
Simultaneously, New Zealand's new government announced an NZD 14.7 billion tax cut package for low and middle-income households. A more lax fiscal policy has softened expectations of imminent rate cuts by the Reserve Bank of New Zealand (RBNZ) which could eventually limit the losses for the Kiwi. The odds of a cut in November fell slightly but remain priced at around 70%.
AUD/NZD technical analysis
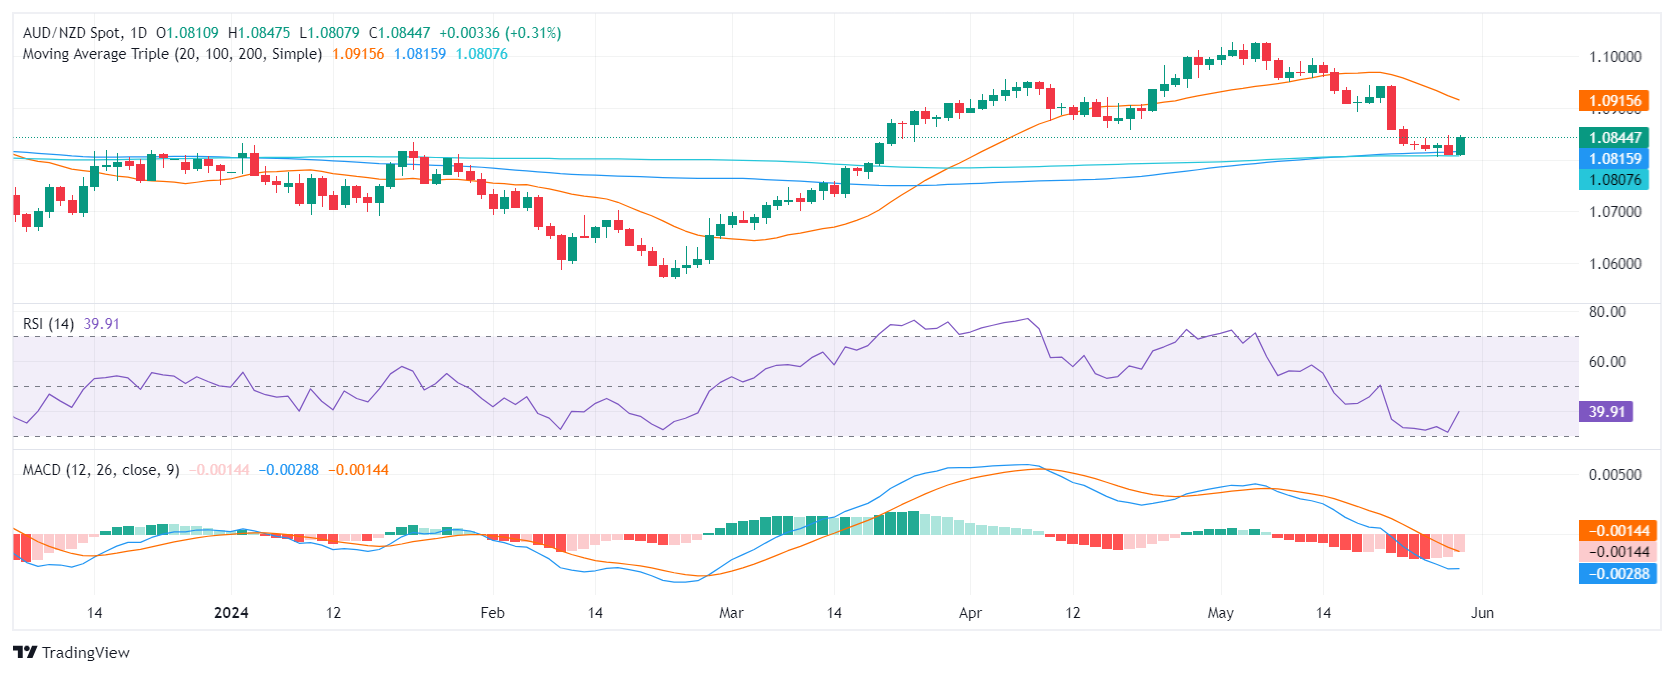
On the daily chart, the Relative Strength Index (RSI) remains in negative territory, indicating a firm downtrend. The persistent rise of the red bars of the Moving Average Convergence Divergence (MACD) histogram further solidifies this downward momentum.
However, as the pair approached oversold territory on Wednesday indicators saw a slight upward correction on Thursday, which is in line with the latest market developments as sellers seem to be taking a breather.
AUD/NZD daily chart


© 2000-2026. Bản quyền Teletrade.
Trang web này được quản lý bởi Teletrade D.J. LLC 2351 LLC 2022 (Euro House, Richmond Hill Road, Kingstown, VC0100, St. Vincent and the Grenadines).
Thông tin trên trang web không phải là cơ sở để đưa ra quyết định đầu tư và chỉ được cung cấp cho mục đích làm quen.
Giao dịch trên thị trường tài chính (đặc biệt là giao dịch sử dụng các công cụ biên) mở ra những cơ hội lớn và tạo điều kiện cho các nhà đầu tư sẵn sàng mạo hiểm để thu lợi nhuận, tuy nhiên nó mang trong mình nguy cơ rủi ro khá cao. Chính vì vậy trước khi tiến hành giao dịch cần phải xem xét mọi mặt vấn đề chấp nhận tiến hành giao dịch cụ thể xét theo quan điểm của nguồn lực tài chính sẵn có và mức độ am hiểu thị trường tài chính.
Sử dụng thông tin: sử dụng toàn bộ hay riêng biệt các dữ liệu trên trang web của công ty TeleTrade như một nguồn cung cấp thông tin nhất định. Việc sử dụng tư liệu từ trang web cần kèm theo liên kết đến trang teletrade.vn. Việc tự động thu thập số liệu cũng như thông tin từ trang web TeleTrade đều không được phép.
Xin vui lòng liên hệ với pr@teletrade.global nếu có câu hỏi.
ngân hàng