- Phân tích
- Tin tức và các công cụ
- Tin tức thị trường
- EUR/JPY Price Analysis: Cross faces further correction as bulls retreat
EUR/JPY Price Analysis: Cross faces further correction as bulls retreat
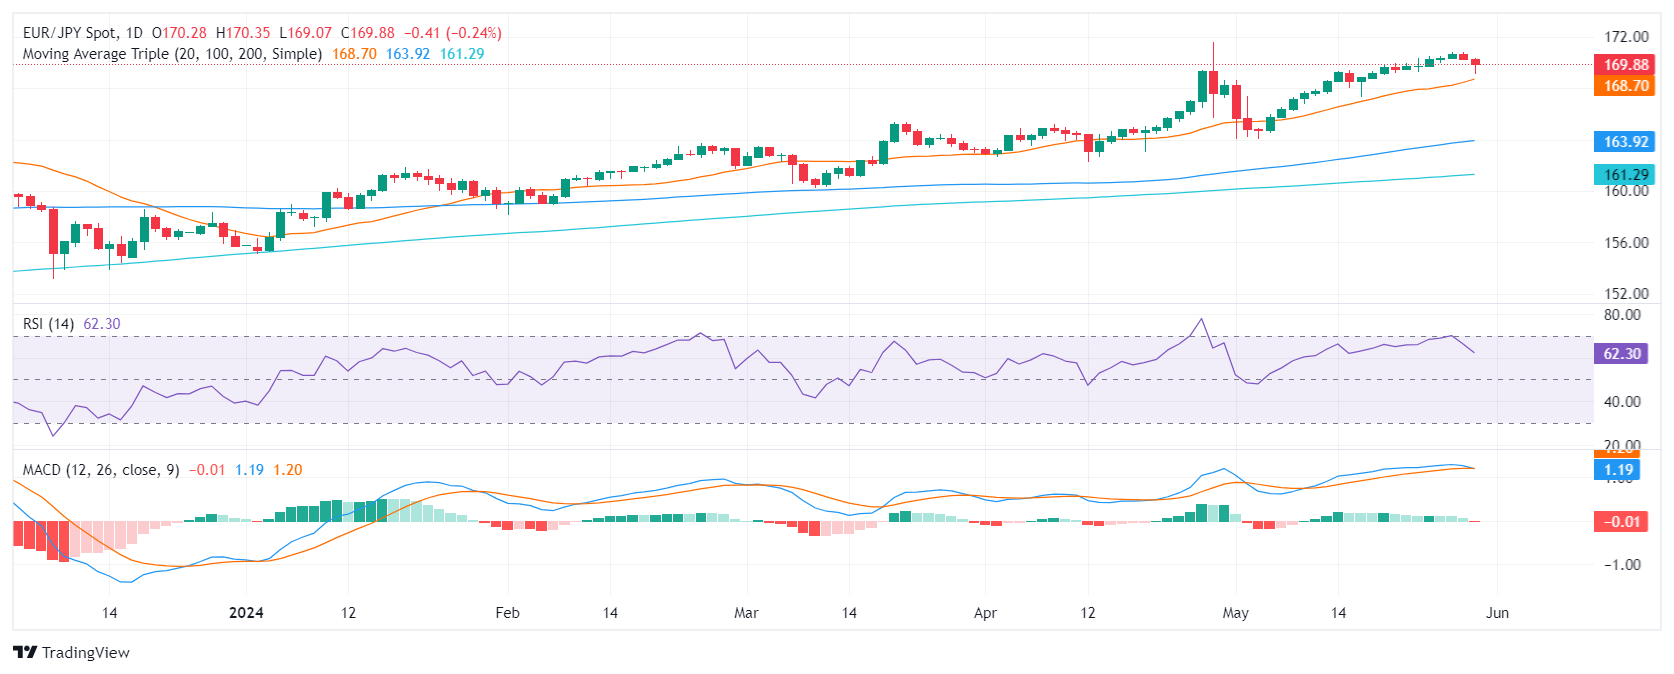
- The daily RSI is pointing downwards, standing near 70, and the MACD has printed a fresh red bar, indicating a deeper consolidation phase.
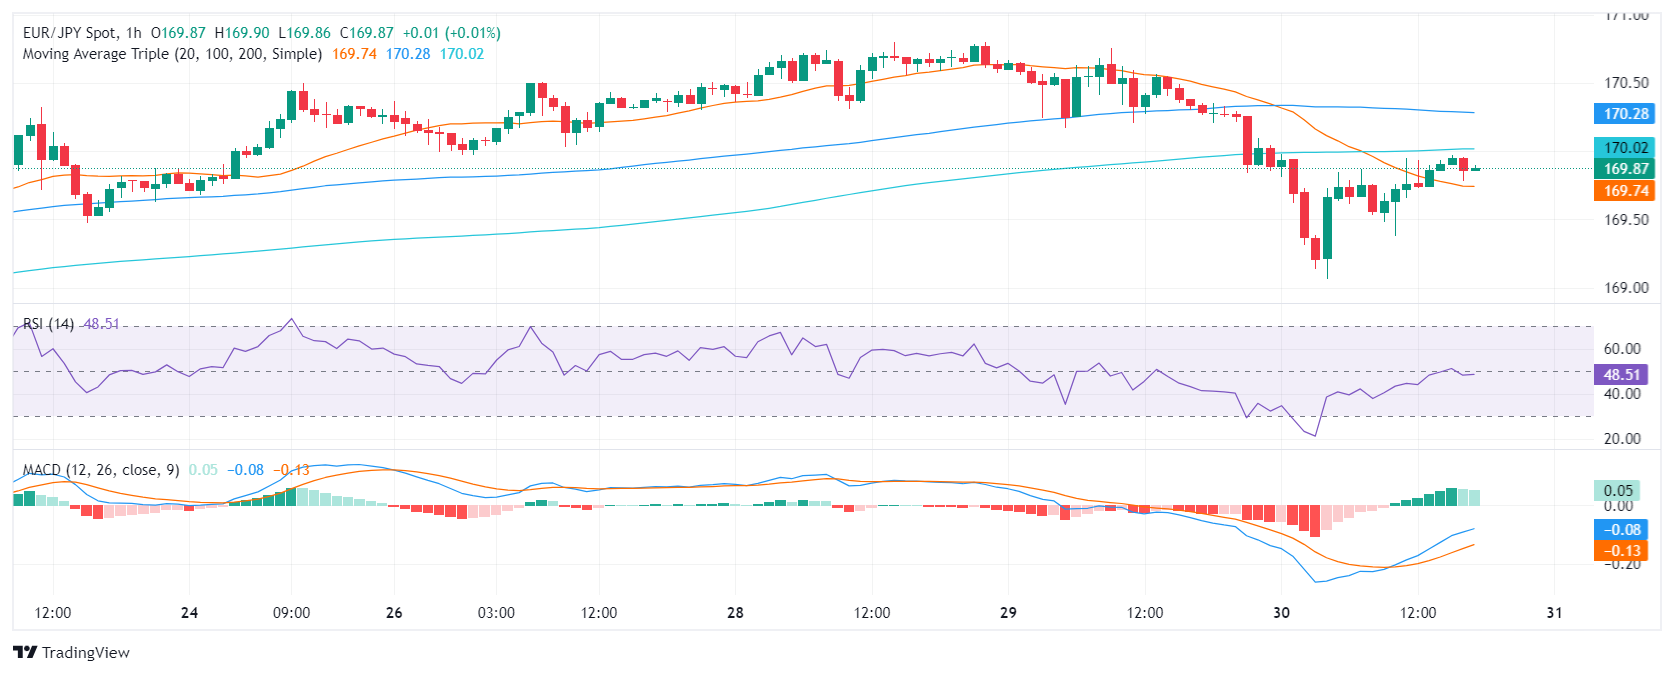
- On the hourly chart, indicators have flattened in the negative terrain, affirming an extended correction phase.
- The EUR/JPY's position above main SMAs continues to support a long-term bullish sentiment.
During Thursday's session, the EUR/JPY pair extended its correction to a daily low of 169.00 before stabilizing around 170.00. This indicates a continuation of the previous session's retreating bullish momentum. The main focus should be observed around the 170-169.00 range, anticipating further correction movements before confirming alterations to the trend.
In the daily analysis, the Relative Strength Index (RSI) and the Moving Average Convergence Divergence (MACD) point toward a deeper correction phase. The RSI is pointing downwards near 70 while the MACD has printed a fresh red bar. Both reflect the curbed bullish trend leading to a consolidation phase.
EUR/JPY daily chart
On the hourly chart, indicators have flattened in the negative area. This signals a reinforcing of the ongoing correction phase, likely a response to recent gains.
EUR/JPY hourly chart
Significantly, the current position of the EUR/JPY pair above the 20-day SMA at 168.70, although being tested, keeps the near-term bullish sentiment intact. Movements below this might fundamentally shift the bullish scenario. Below this market point, the 100 and 200-day SMA provide extra safety barriers for potential sellers.


© 2000-2026. Bản quyền Teletrade.
Trang web này được quản lý bởi Teletrade D.J. LLC 2351 LLC 2022 (Euro House, Richmond Hill Road, Kingstown, VC0100, St. Vincent and the Grenadines).
Thông tin trên trang web không phải là cơ sở để đưa ra quyết định đầu tư và chỉ được cung cấp cho mục đích làm quen.
Giao dịch trên thị trường tài chính (đặc biệt là giao dịch sử dụng các công cụ biên) mở ra những cơ hội lớn và tạo điều kiện cho các nhà đầu tư sẵn sàng mạo hiểm để thu lợi nhuận, tuy nhiên nó mang trong mình nguy cơ rủi ro khá cao. Chính vì vậy trước khi tiến hành giao dịch cần phải xem xét mọi mặt vấn đề chấp nhận tiến hành giao dịch cụ thể xét theo quan điểm của nguồn lực tài chính sẵn có và mức độ am hiểu thị trường tài chính.
Sử dụng thông tin: sử dụng toàn bộ hay riêng biệt các dữ liệu trên trang web của công ty TeleTrade như một nguồn cung cấp thông tin nhất định. Việc sử dụng tư liệu từ trang web cần kèm theo liên kết đến trang teletrade.vn. Việc tự động thu thập số liệu cũng như thông tin từ trang web TeleTrade đều không được phép.
Xin vui lòng liên hệ với pr@teletrade.global nếu có câu hỏi.
ngân hàng