- Phân tích
- Tin tức và các công cụ
- Tin tức thị trường
- NZD/USD Price Analysis: Bulls take a breather, bears must conquer the 0.6100 mark to start talking
NZD/USD Price Analysis: Bulls take a breather, bears must conquer the 0.6100 mark to start talking
- The NZD/USD is taking a breather after last week’s rally.
- The pair are building a fortification around the 0.6100 area following multiple bullish crossovers of the 20-day SMA.
- Multiple bullish SMA crossovers confirm the positive outlook.
On Thursday, the NZD/USD pair traded neutrally around the 0.6115 level as bullish momentum paused. The outlook turned positive after the pair surged above the 100 and 200-day Simple Moving Averages (SMA) last week, with the 20-day SMA forming a bullish crossover, solidifying support at 0.6100.
In the daily analysis, the Relative Strength Index (RSI) shows a neutral trend with the recent RSI readings at 60, indicating that buying pressure has steadied. The slope has flattened compared to previous sessions, suggesting stability in bullish momentum. This neutral tendency in the RSI coincides with flat green bars on the Moving Average Convergence Divergence (MACD), hinting at a continued yet steady upward trend.
NZD/USD daily chart
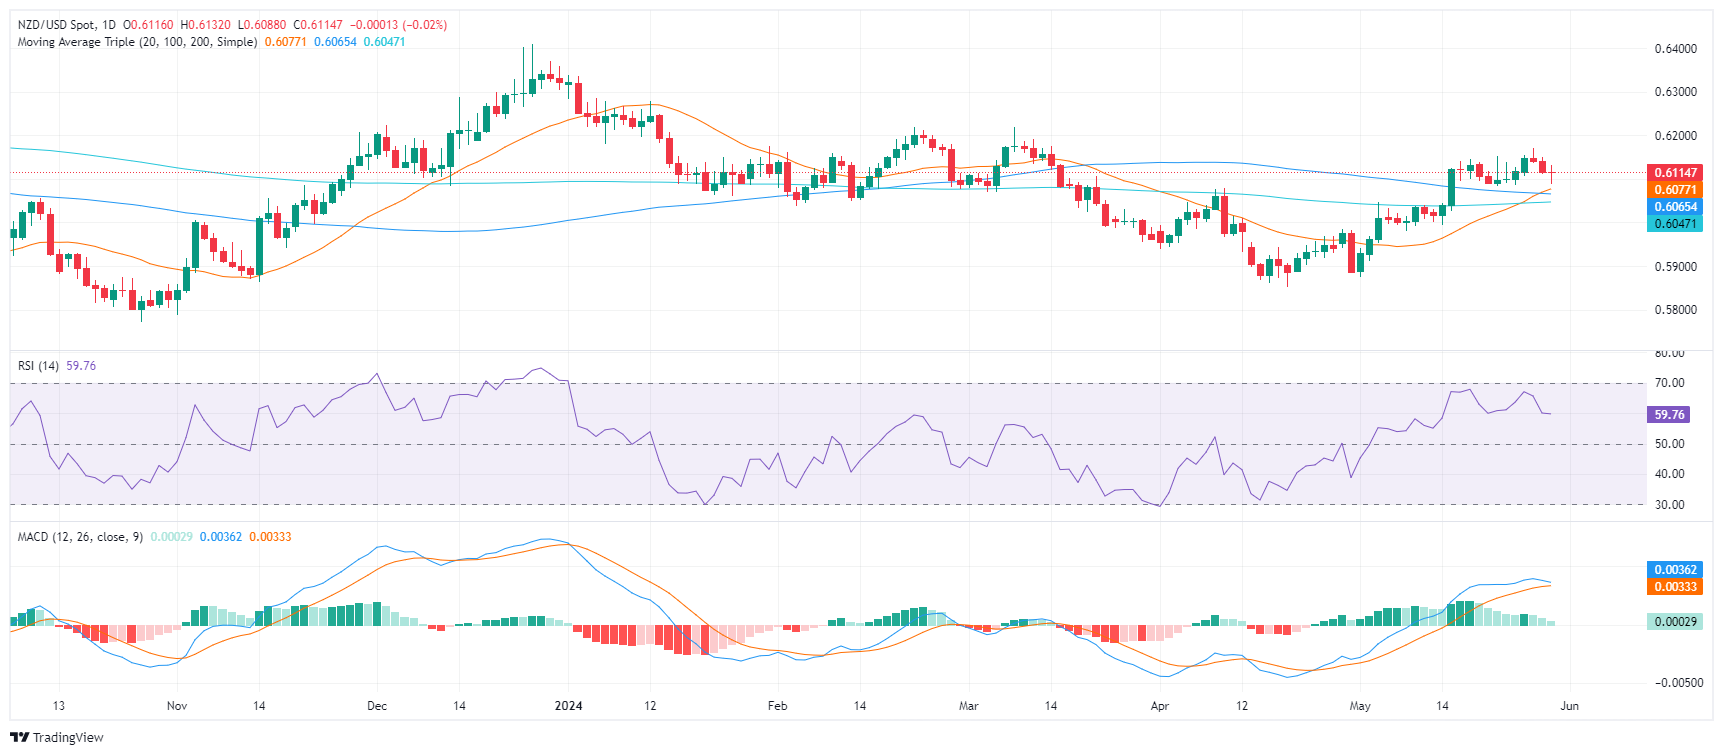
Further support comes from the NZD/USD pair maintaining its position above last week's 100 and 200-day SMA. This was fortified by the 20-day SMA completing a bullish crossover with the 100 and 200-day averages, building robust support around the 0.6100 mark. Any movements that keep the pair above these levels won’t threaten the overall bullish trend.


© 2000-2026. Bản quyền Teletrade.
Trang web này được quản lý bởi Teletrade D.J. LLC 2351 LLC 2022 (Euro House, Richmond Hill Road, Kingstown, VC0100, St. Vincent and the Grenadines).
Thông tin trên trang web không phải là cơ sở để đưa ra quyết định đầu tư và chỉ được cung cấp cho mục đích làm quen.
Giao dịch trên thị trường tài chính (đặc biệt là giao dịch sử dụng các công cụ biên) mở ra những cơ hội lớn và tạo điều kiện cho các nhà đầu tư sẵn sàng mạo hiểm để thu lợi nhuận, tuy nhiên nó mang trong mình nguy cơ rủi ro khá cao. Chính vì vậy trước khi tiến hành giao dịch cần phải xem xét mọi mặt vấn đề chấp nhận tiến hành giao dịch cụ thể xét theo quan điểm của nguồn lực tài chính sẵn có và mức độ am hiểu thị trường tài chính.
Sử dụng thông tin: sử dụng toàn bộ hay riêng biệt các dữ liệu trên trang web của công ty TeleTrade như một nguồn cung cấp thông tin nhất định. Việc sử dụng tư liệu từ trang web cần kèm theo liên kết đến trang teletrade.vn. Việc tự động thu thập số liệu cũng như thông tin từ trang web TeleTrade đều không được phép.
Xin vui lòng liên hệ với pr@teletrade.global nếu có câu hỏi.
ngân hàng