- Phân tích
- Tin tức và các công cụ
- Tin tức thị trường
- NZD/USD Price Analysis: Consolidation phase intensifies, bulls present battle
NZD/USD Price Analysis: Consolidation phase intensifies, bulls present battle
- The NZD/USD stabilizes near 20-day SMA as bears intensify their attempts to breach the20-day SMA.
- Despite spirited defenses, both bulls and bears are yet to make significant headway.
- Daily chart indicators underscore continued consolidation with a slight downward momentum.
The NZD/USD dipped to a low of 0.6115 before recovering and stabilizing at the 20-day Simple Moving Average (SMA) of 0.6140. Both bulls and bears seem locked in an intense tussle with attempts to breach the 0.6220 area and the 20-day SMA respectively proving unsuccessful. This is indicative of an ongoing consolidation phase in the aftermath of Mid-May's sharp increase which saw the pair rise by more than 1.30%.
In the daily chart, the Relative Strength Index (RSI) has switched momentum and is now pointing downwards, suggesting a slight decline in buying pressure. This downward shift in the RSI is consistent with the flat red bars in the Moving Average Convergence Divergence (MACD), which further corroborates the consolidation narrative.
NZD/USD daily chart
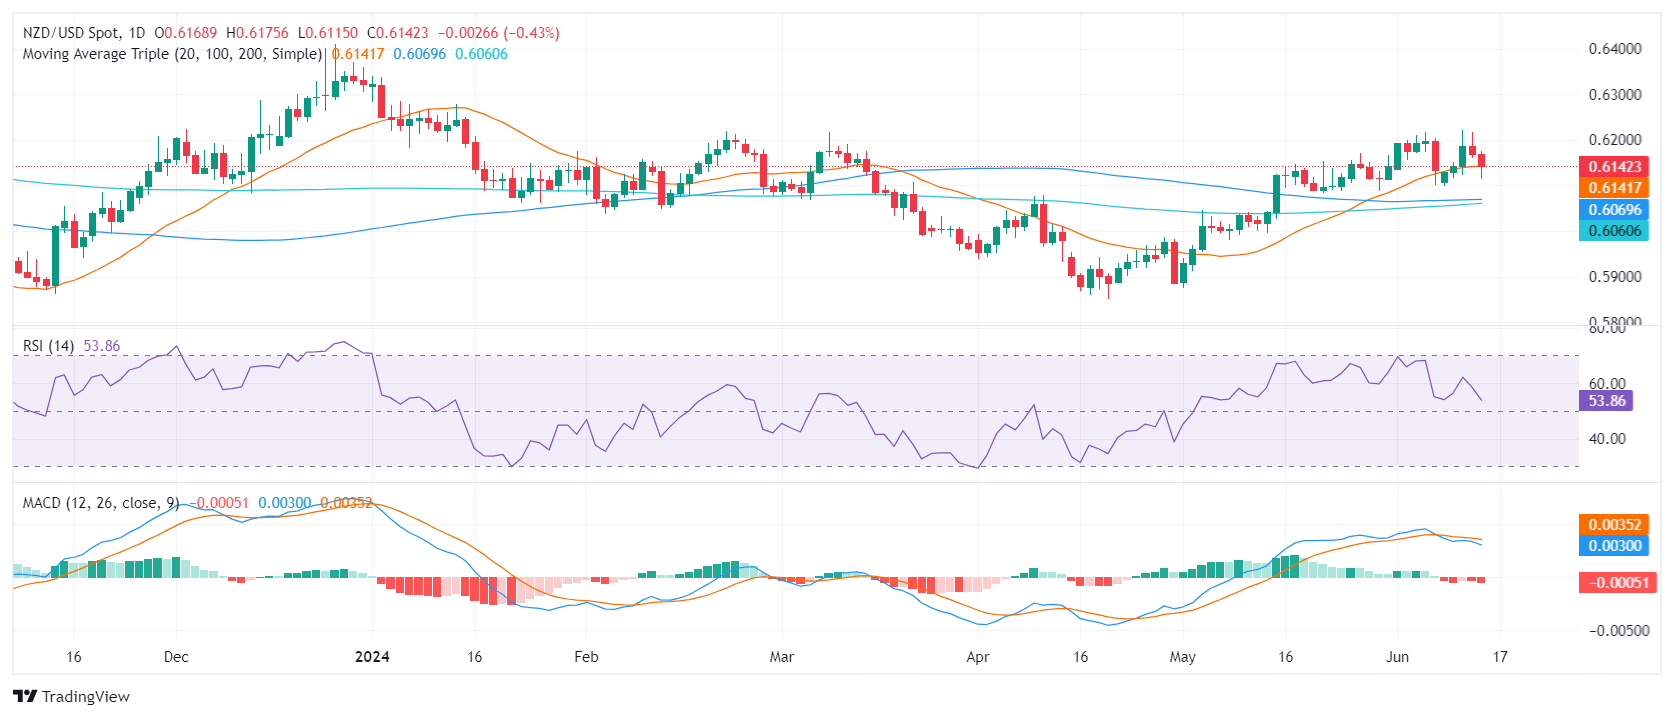
The NZD/USD's immediate support is now at the 20-day SMA of 0.6140, with the 100 and 200-day SMAs converging in the 0.6050-0.6060 region and providing a strong support base for the pair. This could potentially serve as an anchor for correction if bears begin to take control. Any movements below this point of convergence may potentially signal sell conditions.
On the upside, the 0.6200 is the main resistance which in case of being breached, could be considered a buy signal.


© 2000-2026. Bản quyền Teletrade.
Trang web này được quản lý bởi Teletrade D.J. LLC 2351 LLC 2022 (Euro House, Richmond Hill Road, Kingstown, VC0100, St. Vincent and the Grenadines).
Thông tin trên trang web không phải là cơ sở để đưa ra quyết định đầu tư và chỉ được cung cấp cho mục đích làm quen.
Giao dịch trên thị trường tài chính (đặc biệt là giao dịch sử dụng các công cụ biên) mở ra những cơ hội lớn và tạo điều kiện cho các nhà đầu tư sẵn sàng mạo hiểm để thu lợi nhuận, tuy nhiên nó mang trong mình nguy cơ rủi ro khá cao. Chính vì vậy trước khi tiến hành giao dịch cần phải xem xét mọi mặt vấn đề chấp nhận tiến hành giao dịch cụ thể xét theo quan điểm của nguồn lực tài chính sẵn có và mức độ am hiểu thị trường tài chính.
Sử dụng thông tin: sử dụng toàn bộ hay riêng biệt các dữ liệu trên trang web của công ty TeleTrade như một nguồn cung cấp thông tin nhất định. Việc sử dụng tư liệu từ trang web cần kèm theo liên kết đến trang teletrade.vn. Việc tự động thu thập số liệu cũng như thông tin từ trang web TeleTrade đều không được phép.
Xin vui lòng liên hệ với pr@teletrade.global nếu có câu hỏi.
ngân hàng